


0
US Dollar Index
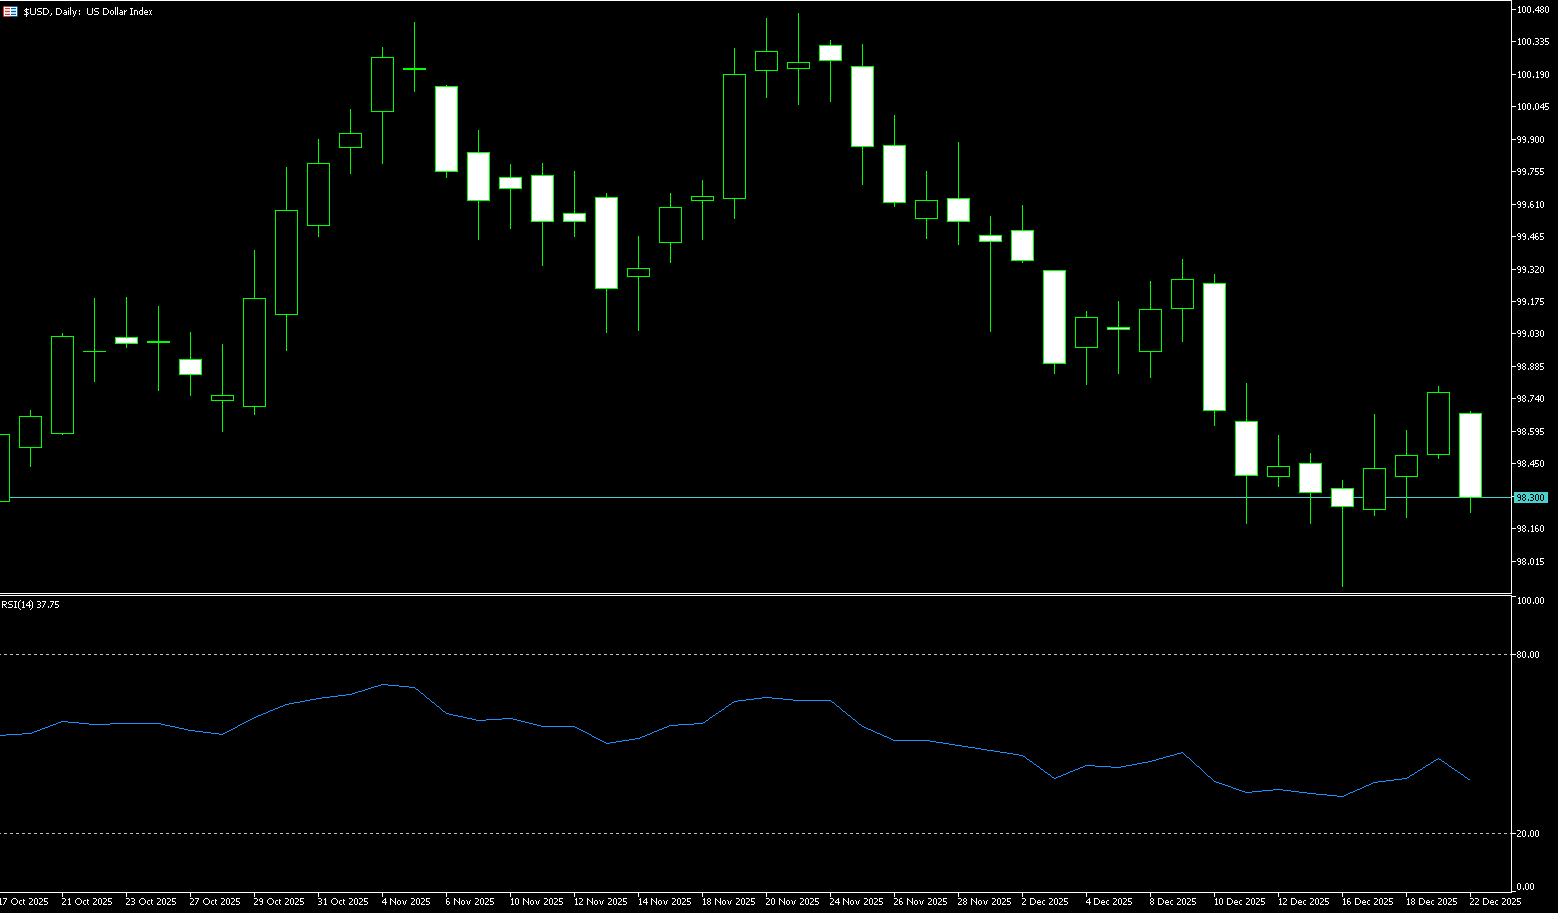
The US dollar index fell below 98.30 on Monday, near its October low, amid expectations that the Federal Reserve will continue to ease monetary policy. The market currently anticipates two rate cuts in 2026, supported by President Trump's calls to lower borrowing costs. However, Fed officials are divided on the policy outlook. Cleveland Fed President Hammark said on Sunday that monetary policy is in a proper position with room to pause in order to assess the impact of the cumulative 75 basis point rate cuts already implemented on the economy. Meanwhile, the governor of Milan reiterated last week that further easing is necessary, stating that inflation has cooled. In addition, precious metals rose, the dollar weakened, and geopolitical tensions between the US and Venezuela escalated, supported by safe-haven demand. The dollar was particularly weak against the yen after the Bank of Japan raised rates last week, pushing borrowing costs to their highest level since 1995.
The dollar's resilience despite negative news is attributed to the accuracy of data, US interest rates nearing the neutral rate, and the dollar's fundamentals being driven by slight improvements in US Treasuries and stocks, as well as support from the yen. Technically, the US dollar index formed a single-day bottoming pattern, then broke through the low and reversed. The 14-day Relative Strength Index (RSI) on the daily chart is in negative territory (38.27) but has not shown a reversal signal. It has reached its first resistance level at 98.80 (the 38.2% Fibonacci retracement level of the 96.22 to 100.39 range), followed by resistance around 99.00 (a psychological level). The first support level is at 98.00 (a psychological level), and a break below this level would target the 97.87 level reached on December 16th.
Today, consider shorting the US dollar index around 98.42; stop loss: 98.55; target: 98.05; 98.00
WTI Crude Oil
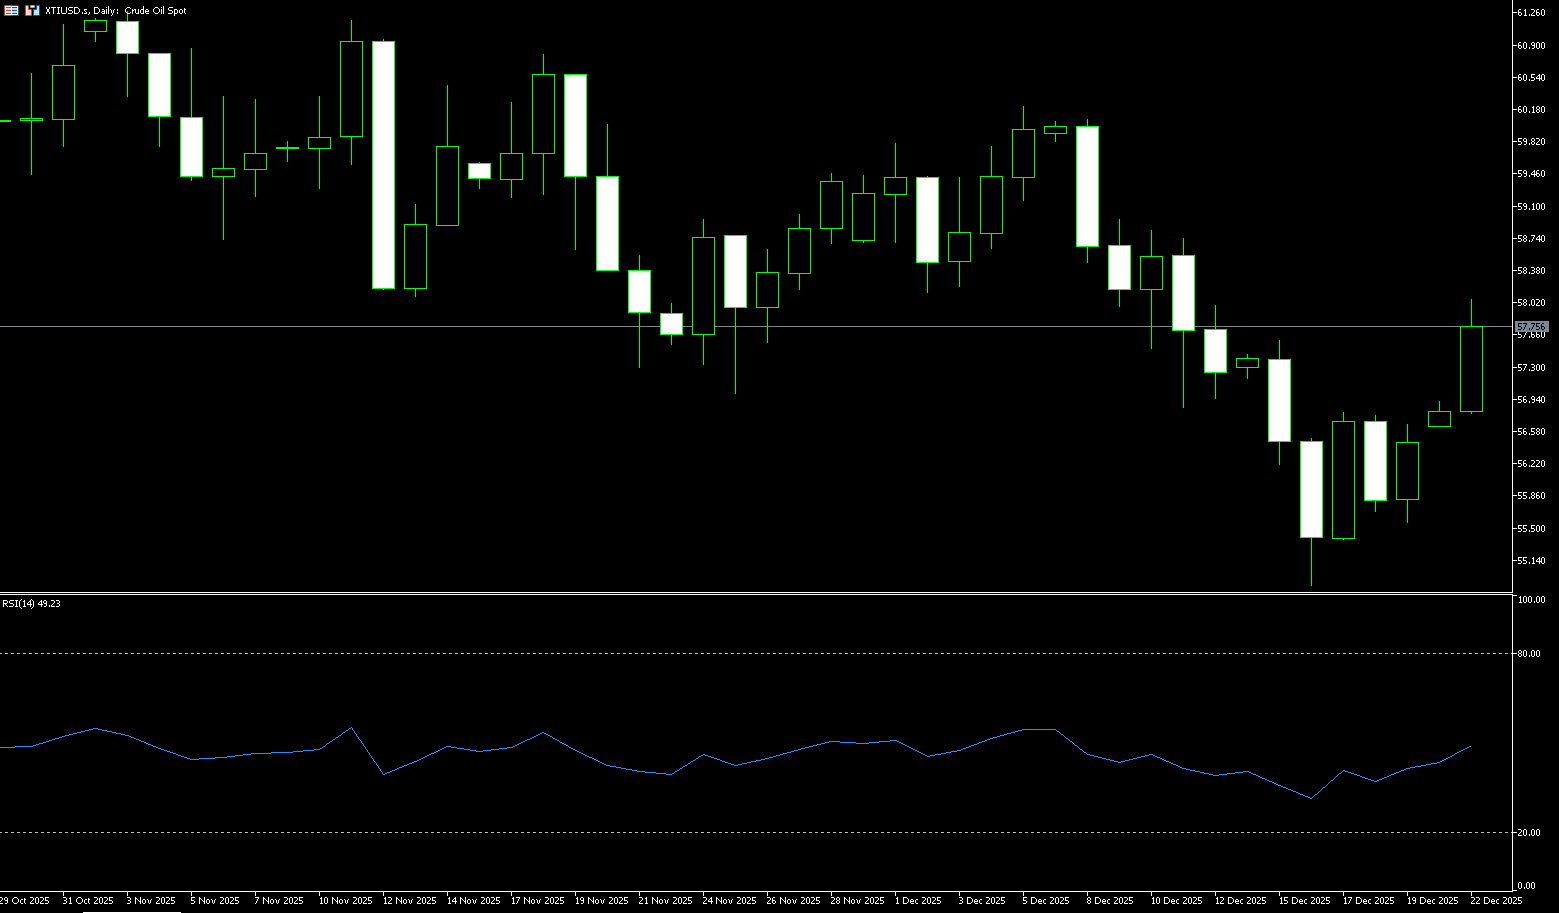
WTI crude oil is trading around $57.00 per barrel, with the market remaining cautious about the geopolitical events in Venezuela. The immediate trigger for rising oil prices was the US interception of a Venezuelan oil tanker at sea and the announcement of new sanctions against Venezuelan President Maduro's family members. This action exacerbated market concerns about further disruptions to Venezuelan oil exports, thus pushing up prices. Meanwhile, the market is also closely watching potential developments in the Russia-Ukraine peace talks. Any news regarding the negotiations could alter expectations for future global energy supplies, thus this uncertainty continues to influence traders' decisions. However, the downstream sector of the crude oil market is showing signs of weakness. US gasoline futures prices fell to a four-year low, causing refining margin indicators to drop to their lowest level since February. This reflects potentially insufficient end-user fuel demand, limiting the upside potential for crude oil prices.
With the Christmas and New Year holidays approaching, trading volumes are shrinking and market liquidity is decreasing, increasing the risk of sharp price fluctuations. Currently, the near nine-month low of $54.88 remains a key reference point for determining the short-term direction of WTI crude oil prices. If oil prices can hold above this level, it will release new buying signals and could potentially retest the 14-day moving average high of $57.60. A break above this high could see oil prices move further towards the medium-term turning point of $58.82 (the 50-day moving average). However, judging from the oscillator trends, the main trend in the crude oil market remains near a downward channel. The market expects that if oil prices rise to this range, selling pressure may re-emerge. The next target is $56.18 (the 5-day moving average). If oil prices fall below the $54.88 support level, they could potentially fall back to the $53.86 level (the January 2020 low).
Today, consider going long on oil around 56.95; Stop loss: 56.80; Target: 58.20; 58.40
Spot Gold
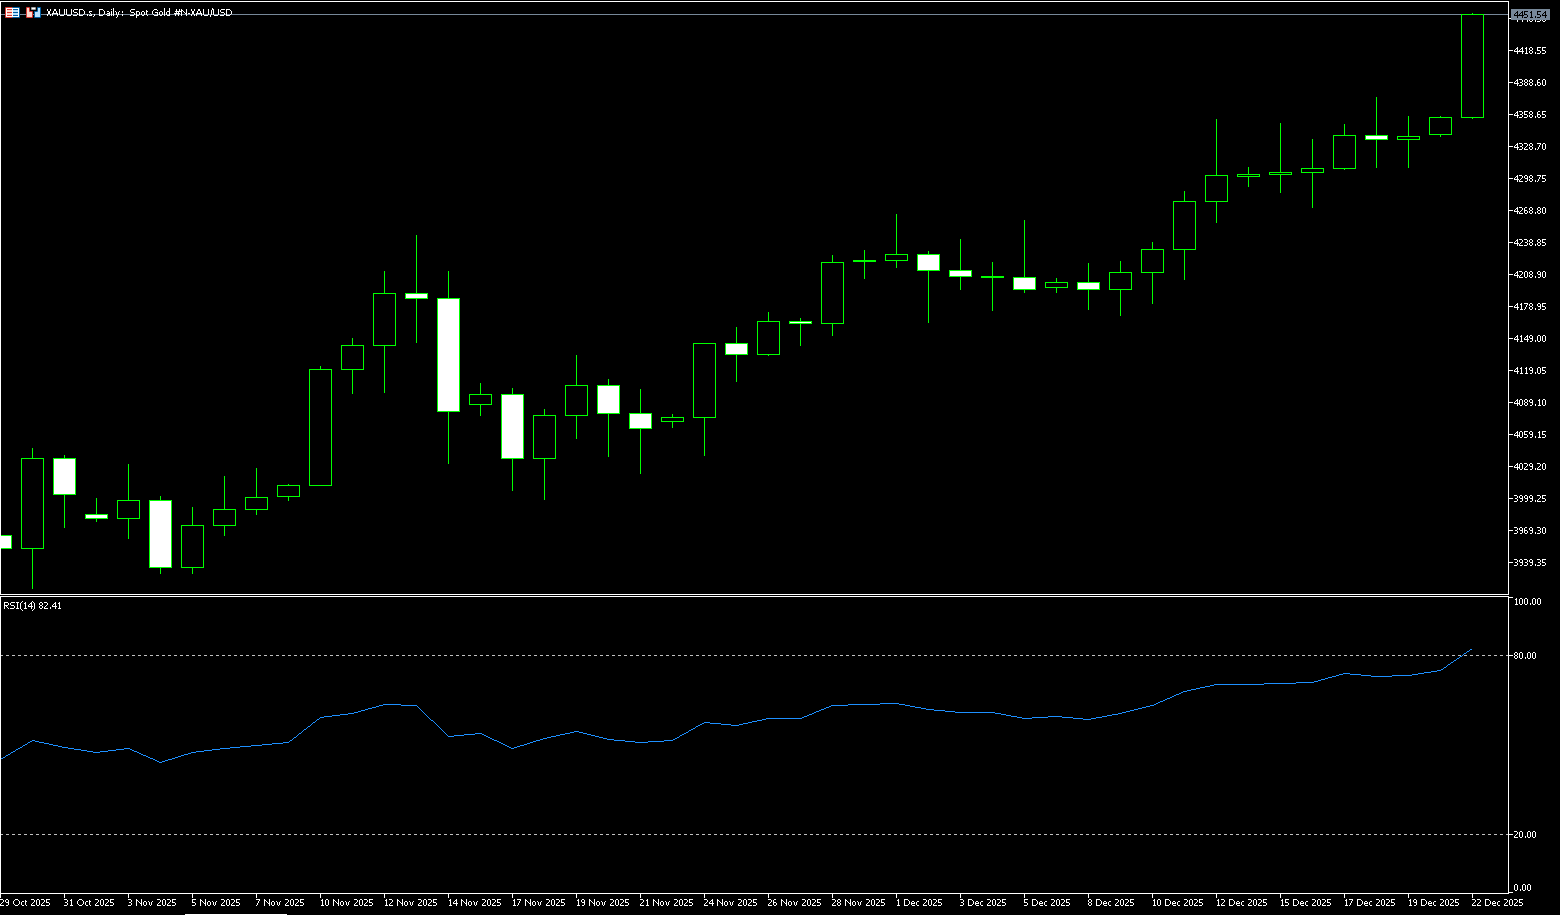
On Monday morning in Europe, spot gold traded around $4,435 per ounce, reaching a high of $4,442, a new all-time high. Market expectations for a Fed rate cut in 2026 continue to rise, and increased geopolitical uncertainty with the approaching Christmas and New Year holidays is providing support for gold prices. Gold is expected to continue rising in a low-interest-rate environment and under pressure from currency devaluation, potentially even reaching a new high of $4,400 in the first half of 2026. The latest developments in the gold market are heavily influenced by the overall precious metals sector. Last Friday, spot gold rose slightly, supported by a recovery in global investment demand. Although the increase was less than silver's 2.5%, its weekly gain of nearly 1% is sufficient to demonstrate market optimism. Weekly gains in other precious metals further strengthened the overall strength of the precious metals sector, indirectly providing support for gold.
From a technical chart perspective, spot gold remains in a clear bullish pattern. The overall structure of the daily gold price chart is healthy. However, the 14-day Relative Strength Index (RSI) has been above 70 for an extended period, clearly indicating that the market is overbought. This doesn't necessarily mean a trend reversal is imminent, but rather that a cooling or correction is needed in the short term to release excess pressure. The most crucial support area is currently at $4,316 (the 9-day moving average), a key level to watch for a potential pullback. A break below this level and failure to recover quickly will likely test the support levels of $4,272 (the December 16 low) and $4,250 (the 20-day moving average). On the upside, $4,381, a previous historical high, has become a new support level. A successful break and hold above this level, without significant overbought conditions, could activate a new wave of momentum, targeting the $4,450 and $4,500 areas.
Consider going long on gold around 4,433 today; Stop loss: 4,428; Target: 4,465; 4,475
AUD/USD
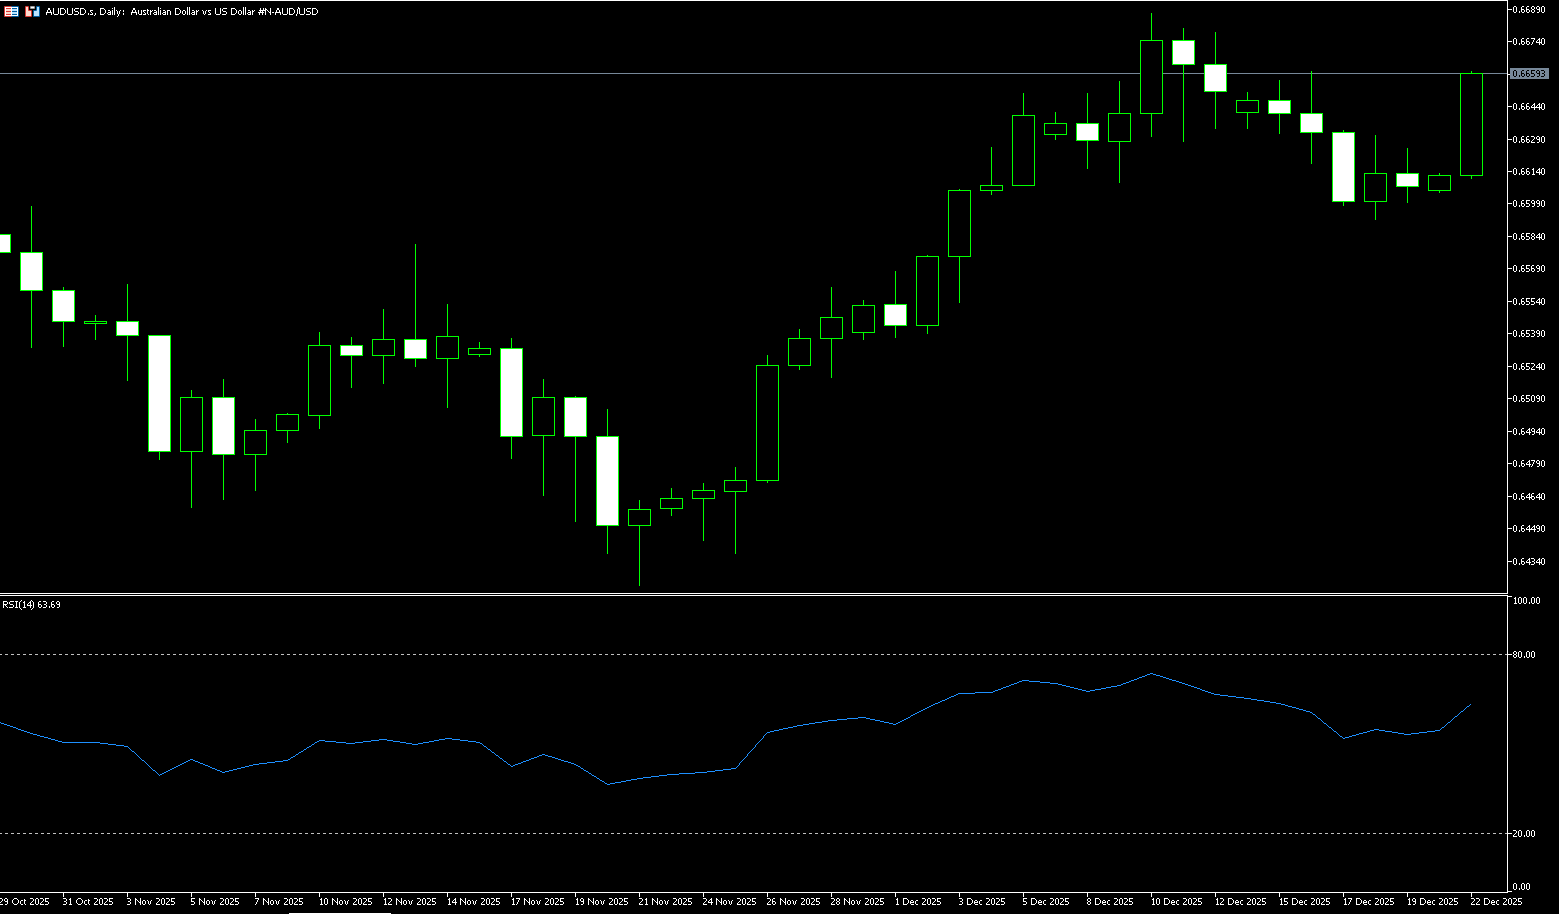
The Australian dollar maintained its gains against the US dollar on Monday after the People's Bank of China announced it would keep its Loan Prime Rate (LPR) unchanged. The one-year and five-year LPRs are 3.00% and 3.50% respectively. Traders will likely focus on the Reserve Bank of Australia's (RBA) meeting minutes to be released on Tuesday for clues about the central bank's policy outlook and its assessment of inflationary pressures. As of December 18, the ASX 30-day interbank cash rate futures contract for February 2026 was trading at 96.34, implying a 27% probability of a rate hike to 3.85% at the next RBA board meeting. Currently, the US Dollar Index, which measures the dollar's value against six major currencies, is losing ground and is currently trading around 98.60. Traders are awaiting the release of the US third-quarter annualized GDP figures on Tuesday. On the other hand, Australian consumer inflation expectations rose to 4.7% in December from a three-month low of 4.5% in November, supporting the Reserve Bank of Australia's hawkish stance.
The Australian dollar traded above 0.6650 against the US dollar on Monday. Technical analysis on the daily chart shows the overall trend remains bullish, with support levels holding, and further price action could provide clearer direction. The 14-day Relative Strength Index (RSI) is around 58.00, reflecting neutral to bullish conditions and accumulating momentum. It remains above the midline, maintaining bullish control. The 9-day simple moving average (0.6639) is trending upwards and is located near the lower end of the price range. However, it has flattened out over the past period, indicating short-term sideways momentum. The pair maintains a modest upward trend as the 20-day simple moving average (0.6602) slope remains positive, while the price consolidates below the moving average. Currently, the Australian dollar is hovering around 0.6650-0.6640 against the US dollar. A sustained break above this level would strengthen short-term momentum, paving the way for a three-month high of 0.6685 and 0.6707 (the highest point since October 2024). On the downside, a decisive break below the 20-day simple moving average at 0.6602 could increase downward pressure, exposing the 100-day moving average at 0.6550, and a breach of that level could test the psychological level of 0.6500.
Consider going long on the Australian dollar today around 0.6645; Stop loss: 0.6630; Target: 0.6690; 0.6680
GBP/USD
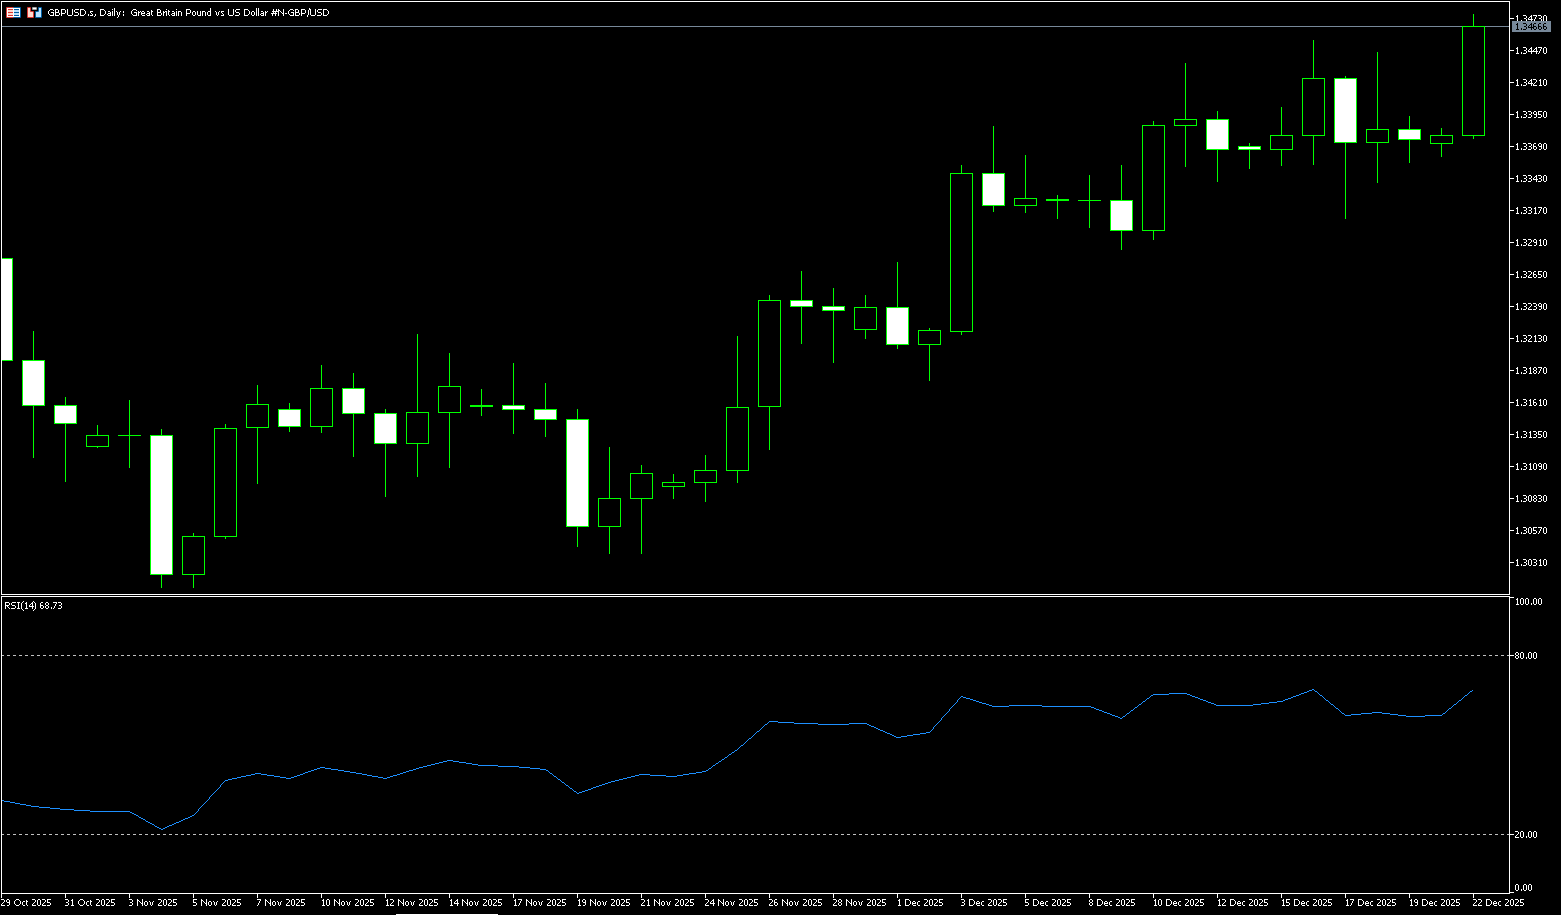
The GBP/USD pair rebounded after three days of declines, trading near 1.3477 on Monday during the European session, reaching a two-month high. The pound remained stable ahead of the UK's third-quarter GDP release. The pound may face headwinds as the market has fully priced in the Bank of England's first rate cut in June 2026, with a relatively high probability of a March cut at 40%. The dollar may strengthen as Federal Reserve Chairman Powell hinted that a near-term rate hike is unlikely and stated that the central bank is in a "wait-and-see" mode to assess upcoming economic data. Traders are also watching US President Trump, who stated last week that the next Fed chairman would be someone who believes in significantly lower interest rates. Meanwhile, Fed Governor Christopher Waller, who is considering the position, reiterated his dovish stance on interest rates on a CNBC forum.
The daily chart shows that GBP/USD has formed a gradually rising structure since its November lows, exhibiting a series of higher highs and higher lows. Recent price action has given a clear signal that the pair is gradually returning to its previous main upward trend from a correction phase. Although the overall trend is bullish, the pair will likely need a period of consolidation or a slight pullback to test lower support levels to accumulate momentum before initiating a new round of upward movement. As long as the support zone of 1.3320 (20-day moving average) to 1.3300 (psychological level) holds, the path of least resistance for the exchange rate will remain upward. A break above the key resistance level of 1.3470 would confirm the official start of a new upward wave, targeting the psychological level of 1.3500. Then comes 1.3527 (October 1st high).
Today, consider going long on GBP around 1.3443; Stop loss: 1.3430; Target: 1.3490; 1.3500
USD/JPY
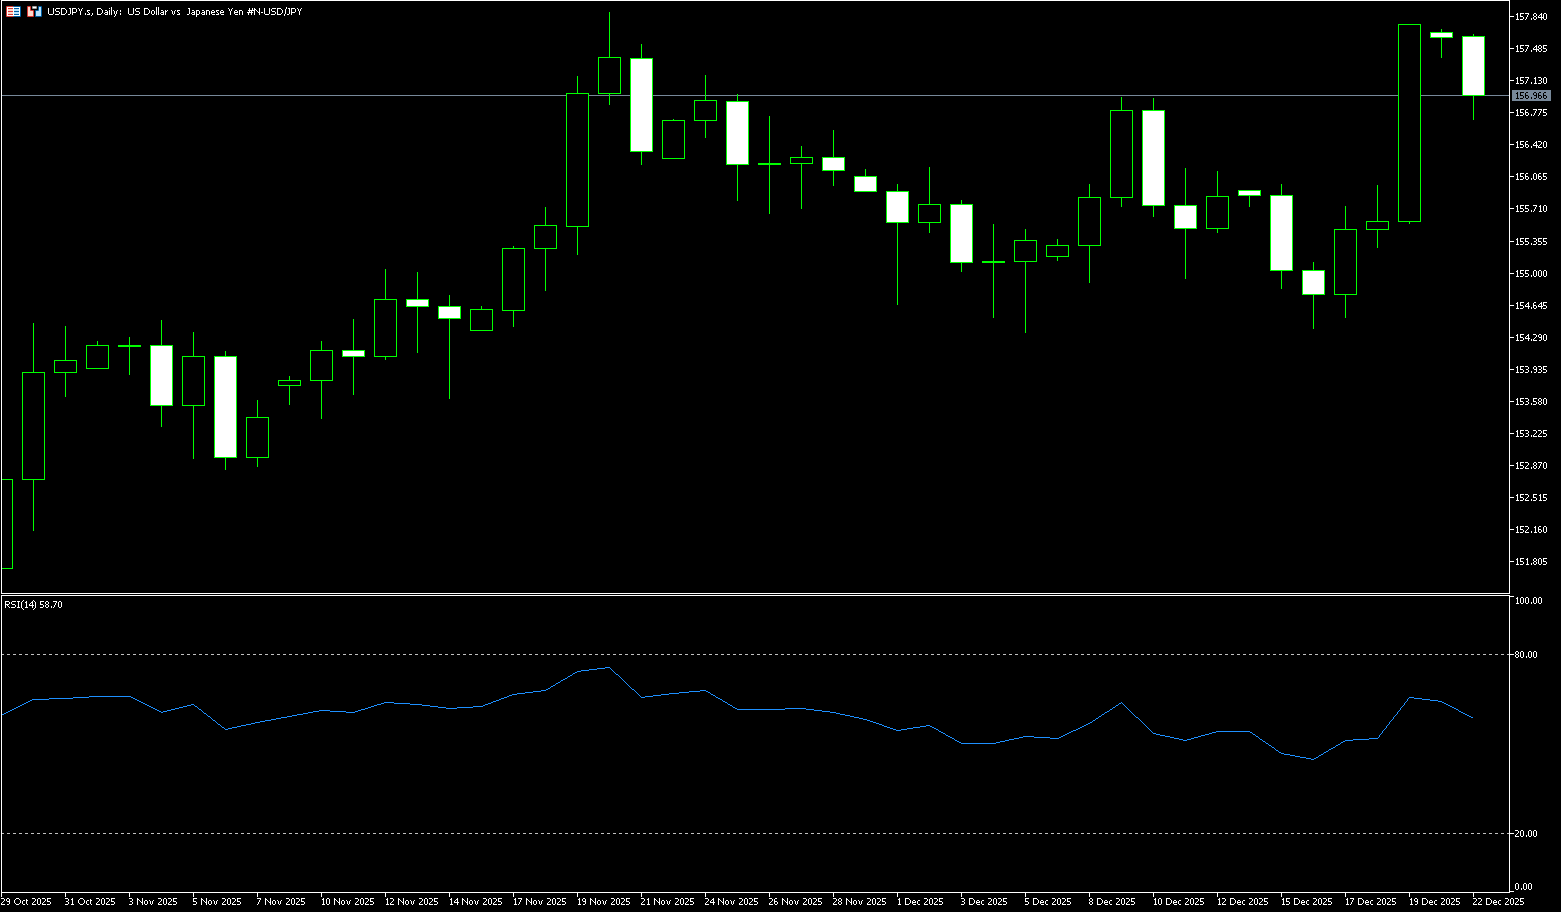
On Monday morning, the USD/JPY exchange rate retreated slightly from around 157.2. The prospect of further rate cuts by the Federal Reserve in 2026 is putting pressure on the dollar relative to the yen. Financial markets may maintain subdued trading sentiment as investors position themselves ahead of the long holiday. Recent weak US inflation and a cooling jobs report have driven market expectations of at least two 25-basis-point rate cuts by the Federal Reserve next year. This contrasts with the Bank of Japan's generally more hawkish shift, putting some selling pressure on the dollar in the short term. Following its two-day policy meeting which concluded on Friday, the Bank of Japan decided to raise short-term interest rates by 25 basis points to 0.75%, the highest level in 30 years. Despite this hawkish shift, the Bank of Japan has not provided clear forward guidance on the timing of future policy adjustments. Uncertainty surrounding the Bank of Japan's future interest rate path may weaken the yen and create favorable conditions for the currency pair.
The USD/JPY pair is technically exhibiting a highly aggressive trend. The daily chart shows a strong breakout above the Bollinger Band middle line at 155.93, far from the lower Bollinger Band at 154.50, indicating a clear overbought breakout. The MACD indicator shows strong bullish momentum. The current exchange rate is approaching a key high for the year, and market memory clearly points to the intervention by Japanese authorities near 161.96 in July 2024. As the exchange rate rapidly approaches the 158-160 area, the "warning zone" for official intervention is within reach. For the USD/JPY exchange rate, the first resistance zone is between 157.75 (Monday's high) and 158.00 (the psychological level), a level that has acted as resistance multiple times this year and is also an important channel leading to the January high of 158.88. Initial support is located near the 5-day moving average at 156.21, with more crucial support at the Bollinger Bands midline at 155.93.
Today, consider shorting the USD near 157.20; Stop loss: 157.38; Target: 156.30; 156.00
EUR/USD
In early European trading on Monday, the EUR/USD pair rose slightly near 1.1750. The euro strengthened against the dollar after the European Central Bank kept its policy rate unchanged and adopted a more optimistic view of the eurozone economy, demonstrating resilience to global trade shocks. Financial markets may remain subdued as traders lock in profits ahead of the long holiday. Since June, the European Central Bank has kept its key policy rate unchanged at 2.0%, and last week's latest pause in rate hikes was accompanied by upward revisions to its growth and inflation forecasts. This signal of the end of the rate-cutting cycle may provide some support for the euro in the short term. On the other hand, the Federal Reserve is unlikely to raise rates in the near term, and the US central bank is in a "wait-and-see" mode to assess upcoming economic data. The Summary of Economic Projections, also known as the "dot plot," shows a median forecast of only one additional rate cut in 2026. The market currently expects two or more rate cuts next year. This, in turn, could weaken the dollar and provide support for major currency pairs.
The euro/dollar pair's trajectory last week exhibited a typical "rise followed by a pullback, but without breaking the medium-term correction structure" pattern. The 14-day Relative Strength Index (RSI) is around 62.00, in a slightly bullish but not overheated range, indicating that the bulls still have an advantage, but the willingness to chase higher prices has declined more significantly. The MACD remains above the zero line, showing that the trend correction has not yet been reversed, but the momentum of the histogram is slowing down marginally. On the technical chart, the exchange rate reached a high above 1.1800 (a psychological level) and 1.1804 (last week's high) before pulling back to around 1.1700, indicating a significant cooling of short-term bullish momentum. Key areas on the daily chart are concentrated around 1.1680 and 1.1600: the former appears to be a retracement level within the recent upward channel, while the latter corresponds to a stronger structural support zone. On the upside, the 1.1762 (last Thursday's high) to 1.1800 range is considered a short-term resistance area by the market.
Today, consider going long on the Euro around 1.1744; stop loss: 1.1730; targets: 1.1790, 1.1800.

Disclaimer: The information contained herein (1) is proprietary to BCR and/or its content providers; (2) may not be copied or distributed; (3) is not warranted to be accurate, complete or timely; and, (4) does not constitute advice or a recommendation by BCR or its content providers in respect of the investment in financial instruments. Neither BCR or its content providers are responsible for any damages or losses arising from any use of this information. Past performance is no guarantee of future results.
More Coverage


Risk Disclosure:Derivatives are traded over-the-counter on margin, which means they carry a high level of risk and there is a possibility you could lose all of your investment. These products are not suitable for all investors. Please ensure you fully understand the risks and carefully consider your financial situation and trading experience before trading. Seek independent financial advice if necessary before opening an account with BCR.
BCR Co Pty Ltd (Company No. 1975046) is a company incorporated under the laws of the British Virgin Islands, with its registered office at Trident Chambers, Wickham’s Cay 1, Road Town, Tortola, British Virgin Islands, and is licensed and regulated by the British Virgin Islands Financial Services Commission under License No. SIBA/L/19/1122.
Open Bridge Limited (Company No. 16701394) is a company incorporated under the Companies Act 2006 and registered in England and Wales, with its registered address at Kemp House, 160 City Road, London, City Road, London, England, EC1V 2NX. This entity acts solely as a payment processor and does not provide any trading or investment services.

 English
 简体中文
简体中文
 繁體中文
繁體中文
 Bahasa
Melayu
Bahasa
Melayu
 Tiếng
Việt
Tiếng
Việt
 ไทย
ไทย
 日本語
日本語
 한국어
한국어
 ភាសាខ្មែរ
 español