


0
Currency & Commodity Analysis:
US Dollar Index
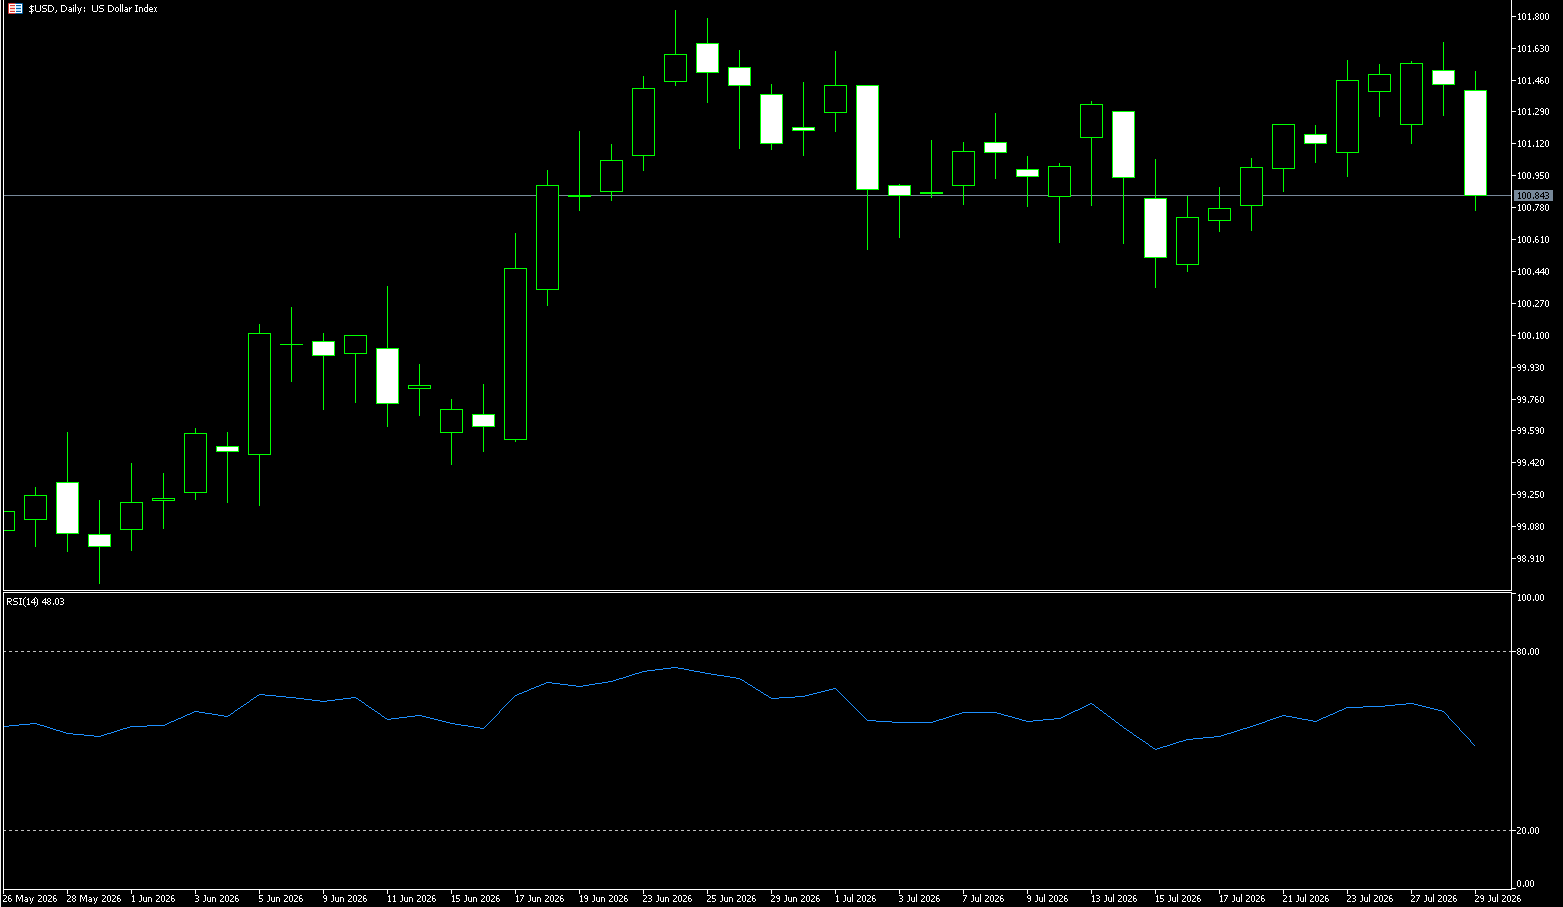
The US dollar index fell to around 100.80 on Wednesday, continuing its pullback after testing a 15-month high of 101.6 in the previous trading day, as the Federal Reserve kept interest rates unchanged. About one-third of market participants expected a rate hike, as rising inflation risks and a strong labor market supported a hawkish stance within the FOMC. Consequently, three members of the committee dissented from a rate hike. Despite another surge in oil prices, a pullback in the US dollar still occurred as strikes between the US and Iran increased the risk of energy shortages in the Middle East. The impact of rising energy prices on interest rates will transmit to other G10 currencies later this month, with soaring natural gas prices supporting the euro and yen. Conversely, the pound sterling continued its strong performance this year, anticipating that the Bank of England might keep interest rates unchanged.
The daily chart shows the US dollar index below 101, indicating that the corrective structure that started from that area has been broken, but the 101.54 to 101.66 area constitutes significant and dense resistance. In the MACD indicator, although the fast and slow lines are still slightly positive, the gap is extremely narrow, meaning that the upward momentum is approaching a critical point. This pattern is closer to high-level equilibrium than trend acceleration. Structurally, 101.00 is also an important reference area for the recent rebound slope. If the US dollar index continues to stay above this level, the market is still pricing in an inflation and policy tightening premium; if it effectively returns to the 101.00 level, then 100.56 and the psychological level of 100.00 will become key areas for determining whether this rebound has ended. On the upside, watch the June high of 101.80 and the 102.00 (psychological level) area; a break above these levels would indicate the market is accepting a higher interest rate path again.
Today, consider shorting the US Dollar Index at 101.00, with a stop-loss at 101.10 and targets of 100.60 and 100.50.
WTI Crude Oil
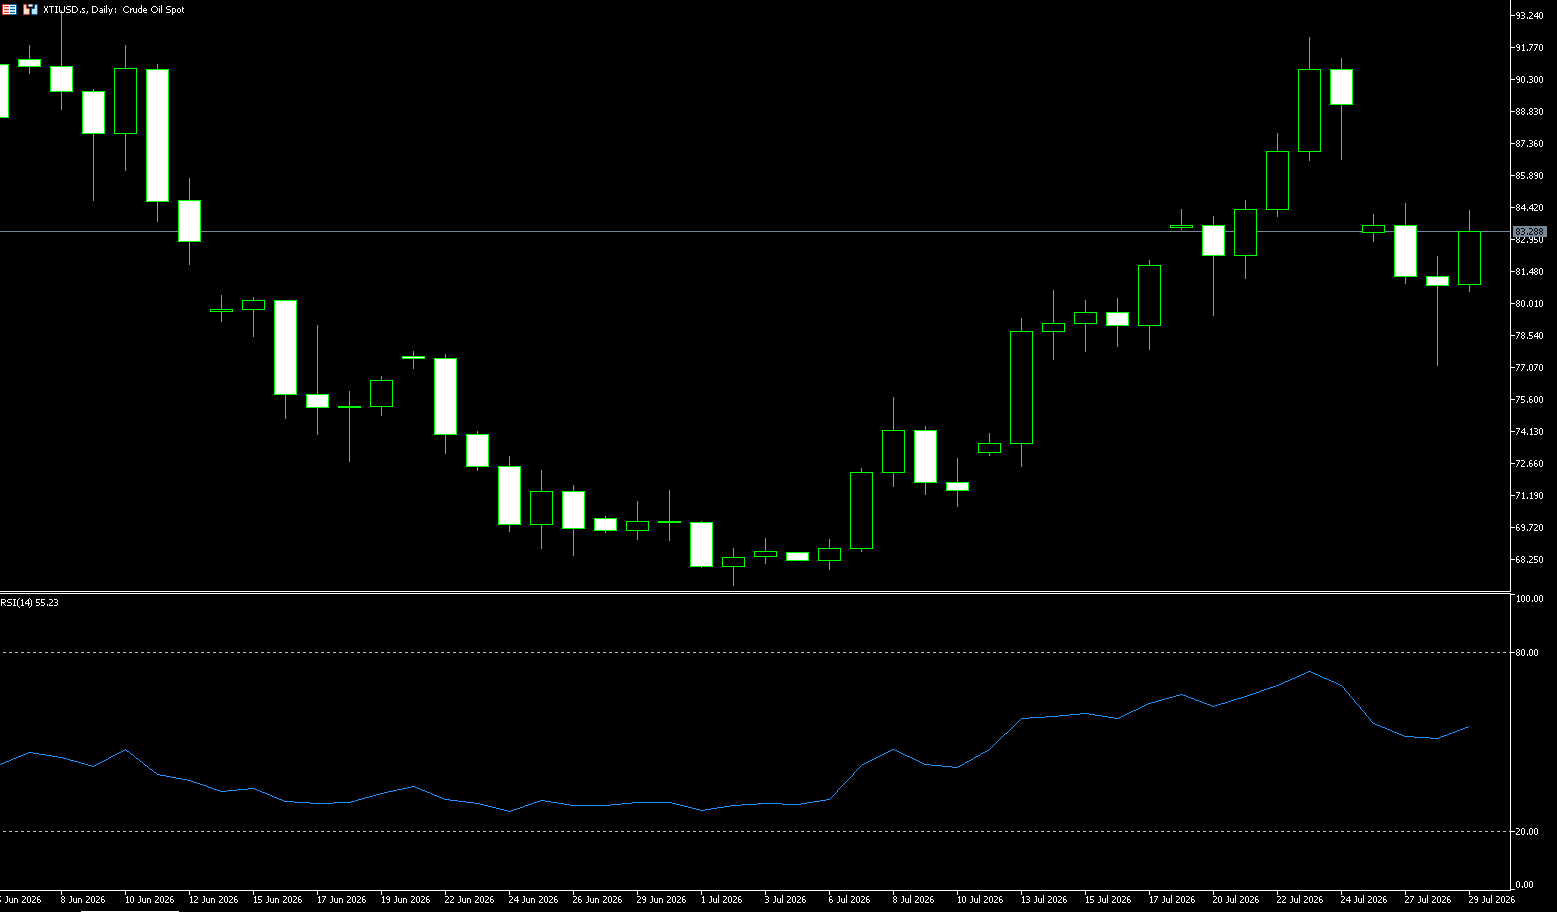
Crude oil prices rose more than 7% on Wednesday, reaching around $83.50 a barrel, ending a three-day losing streak, driven by escalating hostilities in the Middle East. US President Trump stated that the US would take strong action against Iran in retaliation for a potential raid on US forces. This news came after the US military announced it had successfully intercepted a surprise Iranian attack targeting US forces stationed in the Middle East. Meanwhile, Iranian-backed militias launched drones at Saudi Arabian oil facilities in eastern Iraq for the second consecutive day. Furthermore, reports indicate that the Houthi rebels in Yemen are considering charging fees to ships transiting the Red Sea, increasing concerns about shipping costs and energy flows. Iran is also attempting to impose similar fees in the Strait of Hormuz. In the US, API data showed that crude oil inventories fell by 3.3 million barrels last week, indicating continued tight global oil supplies.
The recent rapid rebound in oil prices has significantly factored in the potential blockade of two energy shipping lanes. However, the market does not expect the Houthis to maintain control of the Bab el-Mandeb Strait for long. Additionally, insufficient oil demand due to the global economic recession is also a major constraint on further price increases. Technically, oil prices have broken below the previous upward gap and are currently finding key support near $78.31 (the 20-day moving average), with resistance at the $83.90 (the 9-day moving average) gap. Current oil price movements are typically "headline-driven." While the forward curve reflects market expectations of a medium- to long-term global oil supply-demand surplus, the high volatility of near-month contracts indicates that geopolitical premiums are unlikely to be completely eliminated in one go. Technically, WTI crude oil has rebounded above $80 after a pullback from its highs; initial resistance is currently at the $85.00 level and $83.90 (the 9-day moving average). If oil prices break below the important psychological level of $80.00 again, support is expected near the $78.31 (the 20-day moving average), and a break below that level would test the $75.00 level.
Today, consider going long on crude oil at 83.40, with a stop loss at 83.20 and targets at 8500 and 86.00.
Spot Gold
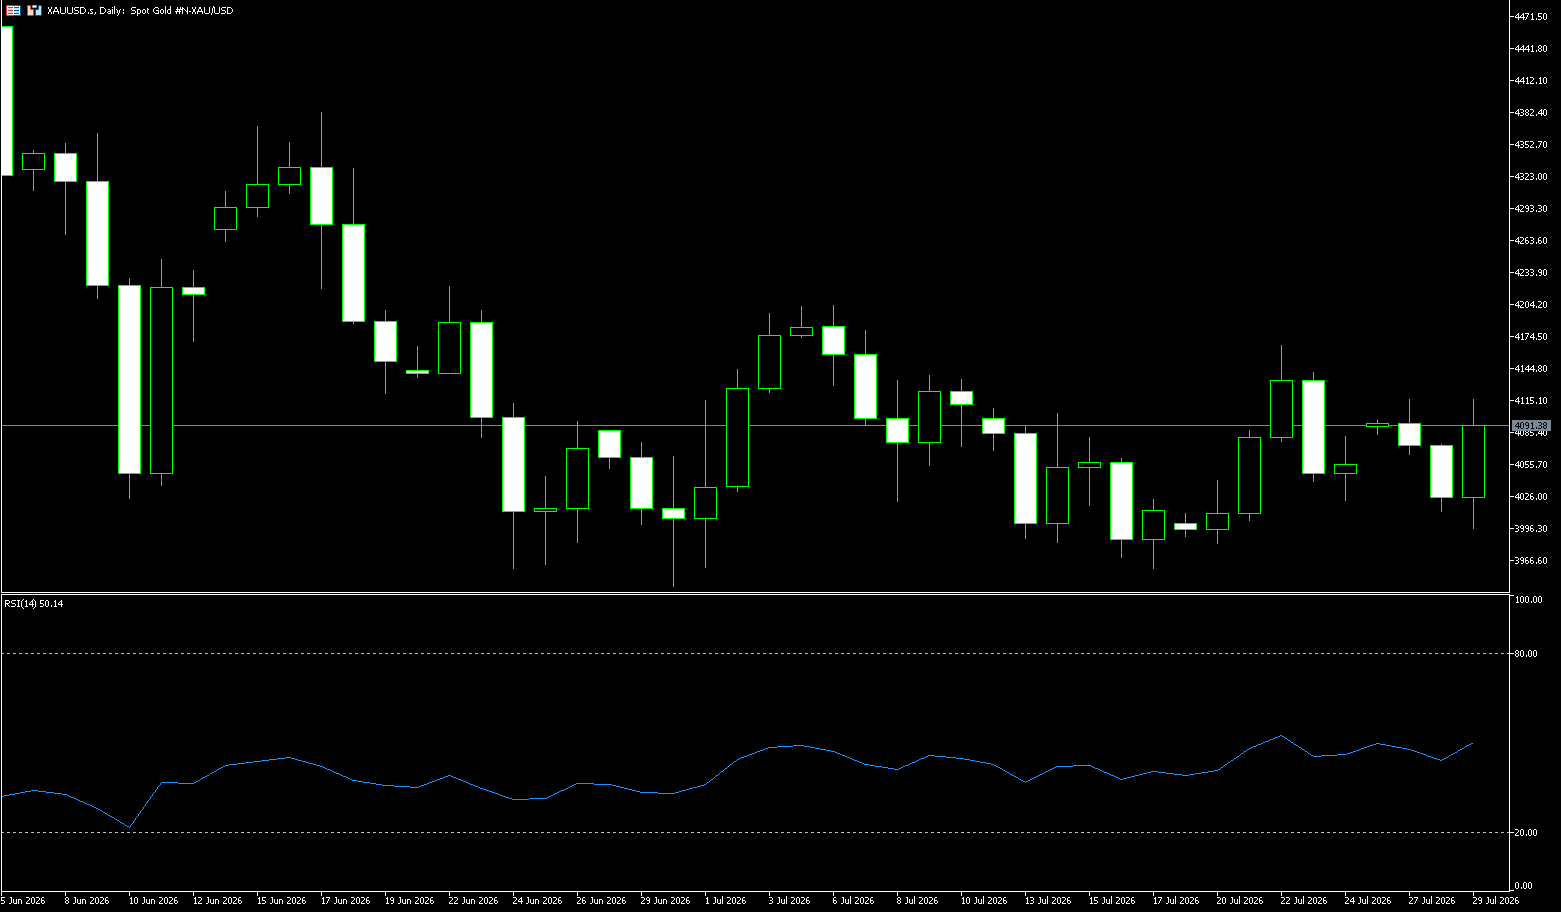
On Wednesday, spot gold traded around $4,065 per ounce. Gold prices fell to a one-week low on Tuesday, dragged down by the dollar remaining near a one-month high, as investors remained cautious ahead of the Fed's interest rate decision and Warsh's speech. The gold market is comprised of "steadfast buyers" (central banks, ETFs, long-term institutions) and "opportunity buyers" (retail investors). The structural allocation by emerging market central banks to avoid dollar credit risk provides a strong bottom, but futures long positions are high, and tactical profit-taking could be triggered when sharp fluctuations in oil prices lead to a rebound in real interest rates. UBS believes that the Middle East situation has a stronger driving force on oil prices; when oil prices fall or strong inflation pushes up US Treasury real yields, gold opportunities arise. Rising holding costs will suppress gold's safe-haven appeal; its core value remains hedging against macroeconomic credit risk rather than single geopolitical events. The outlook for gold prices remains pessimistic. Amidst negotiations and falling oil prices, gold prices continued to decline. Coupled with expectations of hawkish comments from the Federal Reserve, a sell-off may occur early Thursday morning.
Spot gold prices declined. A stronger dollar, high US Treasury yields, and cautious sentiment awaiting this week's Fed rate decision all contributed to the downward pressure on precious metals. Gold traded between $4,020 and $4,082 at the start of the week. Gold held the $4,000 support level but failed to break through the short-term technical breakout range of $4,150–$4,200. Short-term bears hold the technical advantage. Gold prices remained below the upper limit of the $4,166 level (nearly three-week high) and failed to break above the $4,200 psychological level. The primary upside target for bulls is a return above $4082.30 (early week high); a sustained hold above this level would target $4,166, followed by a challenge of $4200. The short-term downside target for bears is a break below $4,000 (a psychological level); further downside targets after that are $3,968.80 (lower Bollinger Band) and $3,900.
Consider going long on gold today at $4,060, with a stop-loss at $4,055; targets: $4,100; $4,120.
AUD/USD
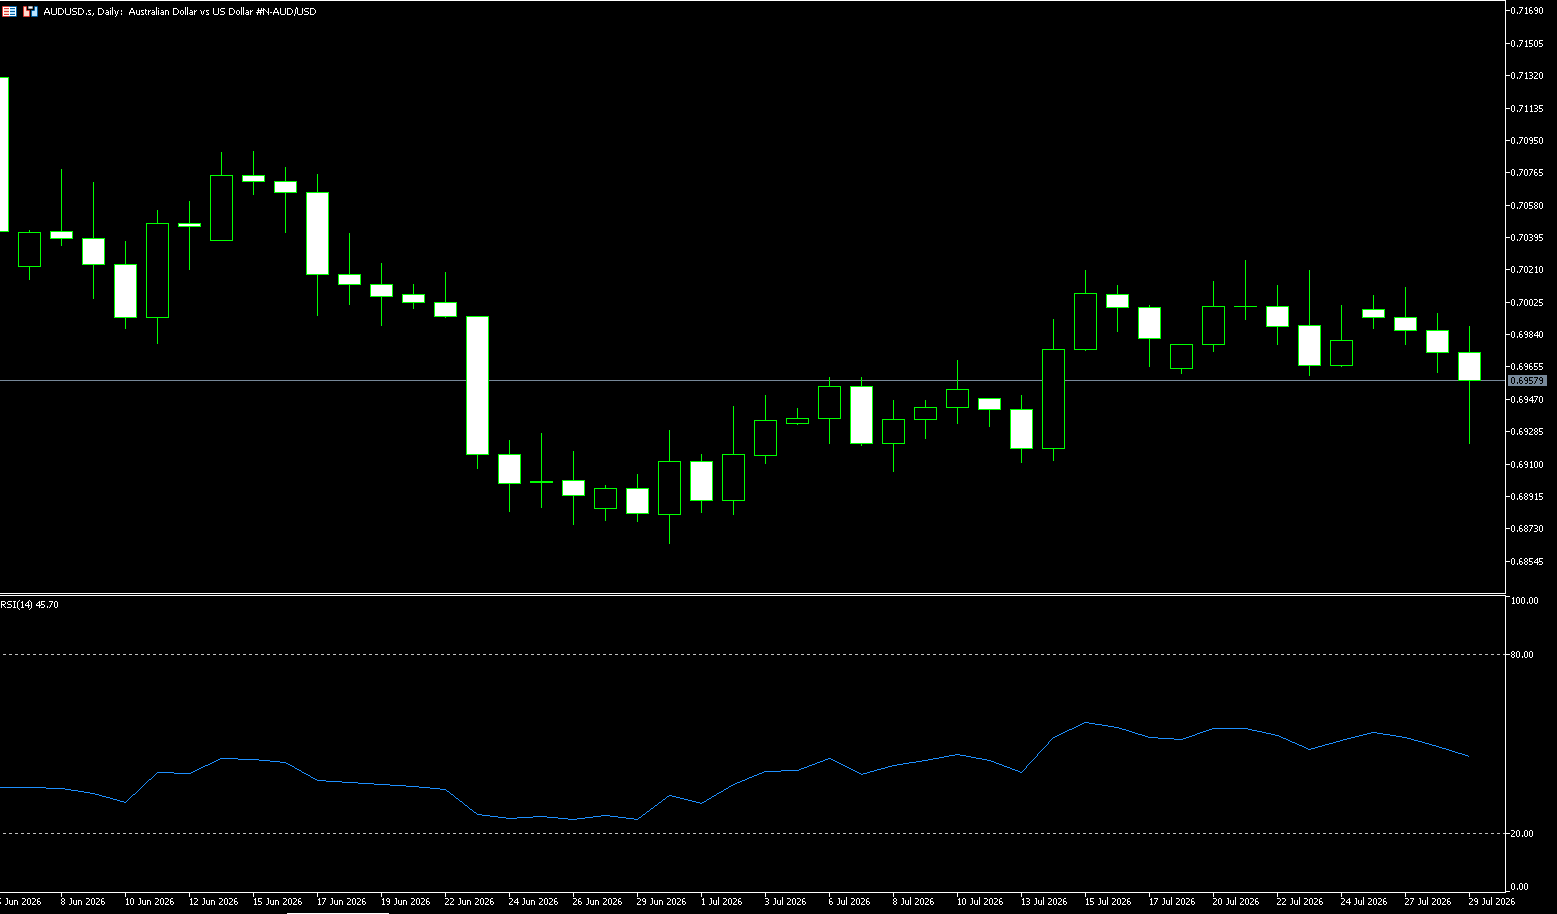
The Australian dollar depreciated below US$0.6960, retreating from multi-week highs as investors reassessed the monetary policy outlook following new comments from the central bank governor. Reserve Bank of Australia Governor Michelle Bullock stated that another rate hike might still be needed to return inflation to the target level, but emphasized that the short-term outlook remains highly uncertain. She noted that further easing of domestic demand and labor market conditions may be necessary before policymakers determine whether previous tightening has been sufficient. Her comments led the market to lower the probability of an August rate hike from about 30% to about 20%, although investors still expect the cash rate to reach 4.60% by the end of the year. Meanwhile, the pause in hostilities between the US and Iran provided support for the risk-sensitive Australian dollar.
On the daily chart, the Australian dollar traded around 0.6950 against the US dollar, maintaining a limited move as it remained above the 200-day simple moving average at 0.6905, but below the 55-day and 100-day simple moving averages at 0.7027 and 0.7053 respectively. This configuration suggests the overall uptrend remains technically intact but faces short-term resistance, with short-term moving averages clustered above limiting upward attempts. The Relative Strength Index (RSI) (14) is around 43, suggesting slightly positive momentum, while the Average Directional Index (ADI) is near 19, indicating a relatively weak trend, favoring consolidation rather than a clear breakout. On the upside, initial resistance lies at 0.7000 (a psychological level), followed by the 55-day simple moving average at 0.7027, forming a dense supply zone that the bulls must break through to regain momentum. Immediate support is provided by the 200-day simple moving average at 0.6905, followed by horizontal support at the 0.6865 level (June 30 low). The overall trend is becoming more clearly bearish.
Consider going long on the Australian dollar today at 0.6940, with a stop loss at 0.6930 and targets at 0.7000 and 0.7010.
GBP/USD
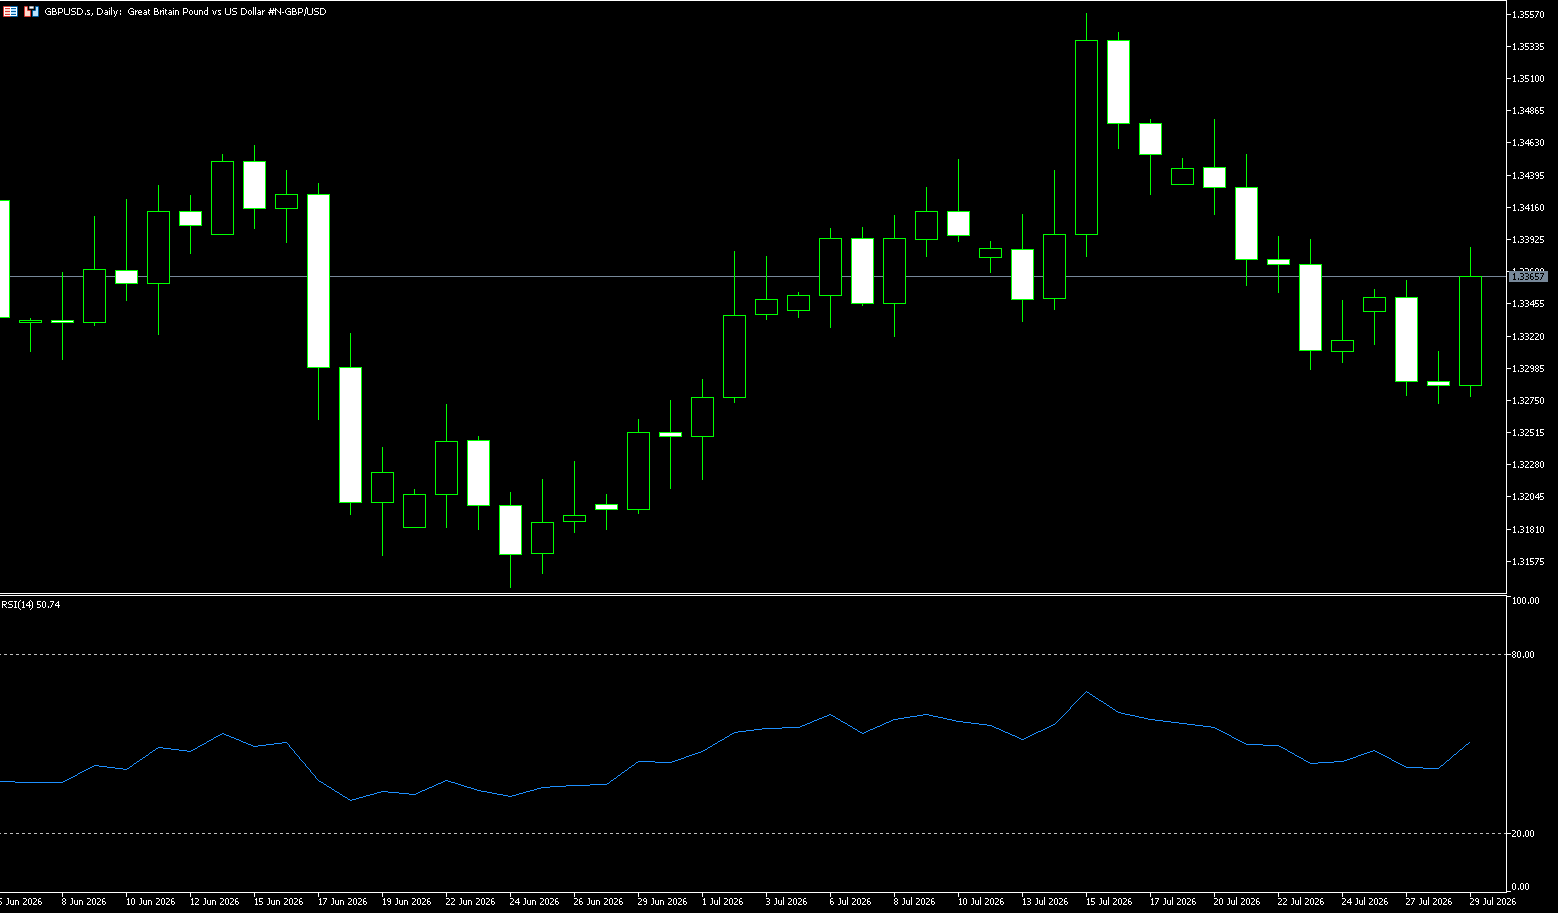
The Federal Reserve maintained its target range for the US dollar at 18:00 GMT, with a vote of 9 to 3.75%, including a 25 basis point immediate rate hike favored by the three voting members. The pound broke below the 1.3300 level lost last week, trading at 1.3350. At the start of the week, the pound fell below $1.33, its lowest level in nearly a month, as investors focused on developments in the Middle East, while the dollar remained supported by market expectations of a possible Fed rate hike on Wednesday. Although the pause in US attacks on Iran led to a drop in oil prices, easing inflation concerns, US Treasury yields only declined slightly, reflecting continued market caution. Investors are also awaiting the Bank of England's policy decision later this week, with the market widely expecting interest rates to remain unchanged at 3.75%. Recent inflation data further solidified this expectation, with June's annual consumer price growth slowing to a 15-month low of 2.6%, below the Bank of England's forecast.
The daily chart shows a bearish near-term trend for the pound against the dollar. The daily Stochastic Relative Strength Index (SRS) is near 50, indicating room for movement on both sides. Therefore, the judgment should be based on structure rather than momentum: the price is below the descending moving average band, the breached support level has been broken after three weeks of defense, and the first two events on the event calendar both pertain to the US dollar. Sell on rallies into this range. This judgment is invalidated if the daily close is above 1.3400. The resistance level at 1.3360 (the 50-day simple moving average) is the first resistance and the breached support level. A daily close above this level would reopen the psychological level of 1.3400. As for support: 1.3300 marks the first target, below which is 1.3250, marking Tuesday's bottom. The summer bottom slightly below 1.3150 remains a structural support line and has not been tested since late June.
Today, consider going long on GBP at 1.3346, with a stop-loss at 1.3335 and targets at 1.3380 and 1.3390.
USD/JPY
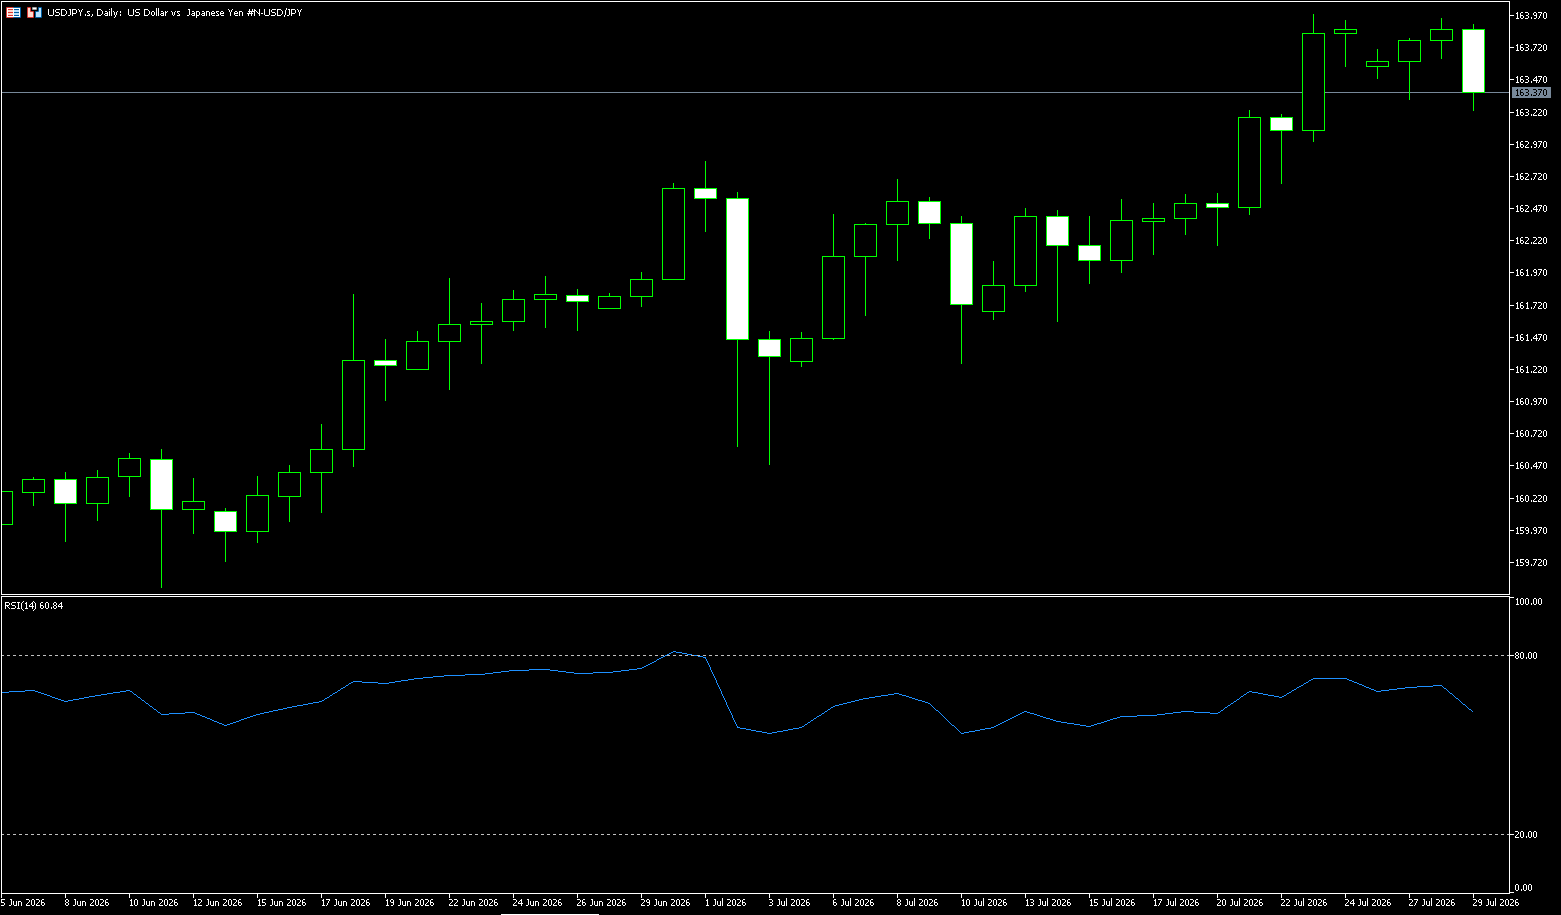
On Wednesday, USD/JPY traded near 164, remaining in a high range. The pair did not weaken further despite the temporary easing of the Middle East conflict and the rapid decline in oil prices; instead, it regained support ahead of the Fed's interest rate meeting. The core market issue has shifted from simple safe-haven demand to the repricing of expectations regarding US and Japanese monetary policy. The Fed will announce its interest rate decision on July 29, while the Bank of Japan will hold its policy meeting on July 30-31. The close timing of these two meetings makes USD/JPY one of the most sensitive prices in macro trading this week. The dollar's rebound is not driven by a single fundamental improvement. Meanwhile, the yield on 10-year US Treasury bonds fell to around 4.6%, and stock market performance was also quite divergent, failing to form a typical structure where rising interest rates and a strengthening dollar were synchronized.
From a daily chart perspective, the latest USD/JPY price is around 163.50, having traded between 163.10 and 163.95 over the past few days. The exchange rate reached a high of 163.95. The price has approached and even briefly broken through the upper band, indicating a strong short-term trend, but also showing that the momentum for further price increases after the expansion of volatility is facing a test. The MACD indicator remains above the zero line, reflecting relatively strong momentum in the medium to short term. However, the exchange rate has shown consecutive short-lived candles after approaching the 164 area, indicating that incremental funds are waiting for confirmation from policy information. The existing cycle high, slightly below 164.00, is the only significant level in the short term, and the pressure from the past three trading days has failed to break through it. The chart above this level has almost no reference before 1986; 164.50 and 165.00 are key psychological levels. Regarding support, 163.00 is the support level broken on July 21st and is also the first level to suggest a true reversal. The 50-day exponential moving average (EMA) near 161.50 is a trendline and is steadily rising, while the 200-day moving average is well below this, near 157.00.
Consider shorting the US dollar today at 163.60, with a stop loss at 163.75 and targets at 162.80 and 162.70.
EUR/USD
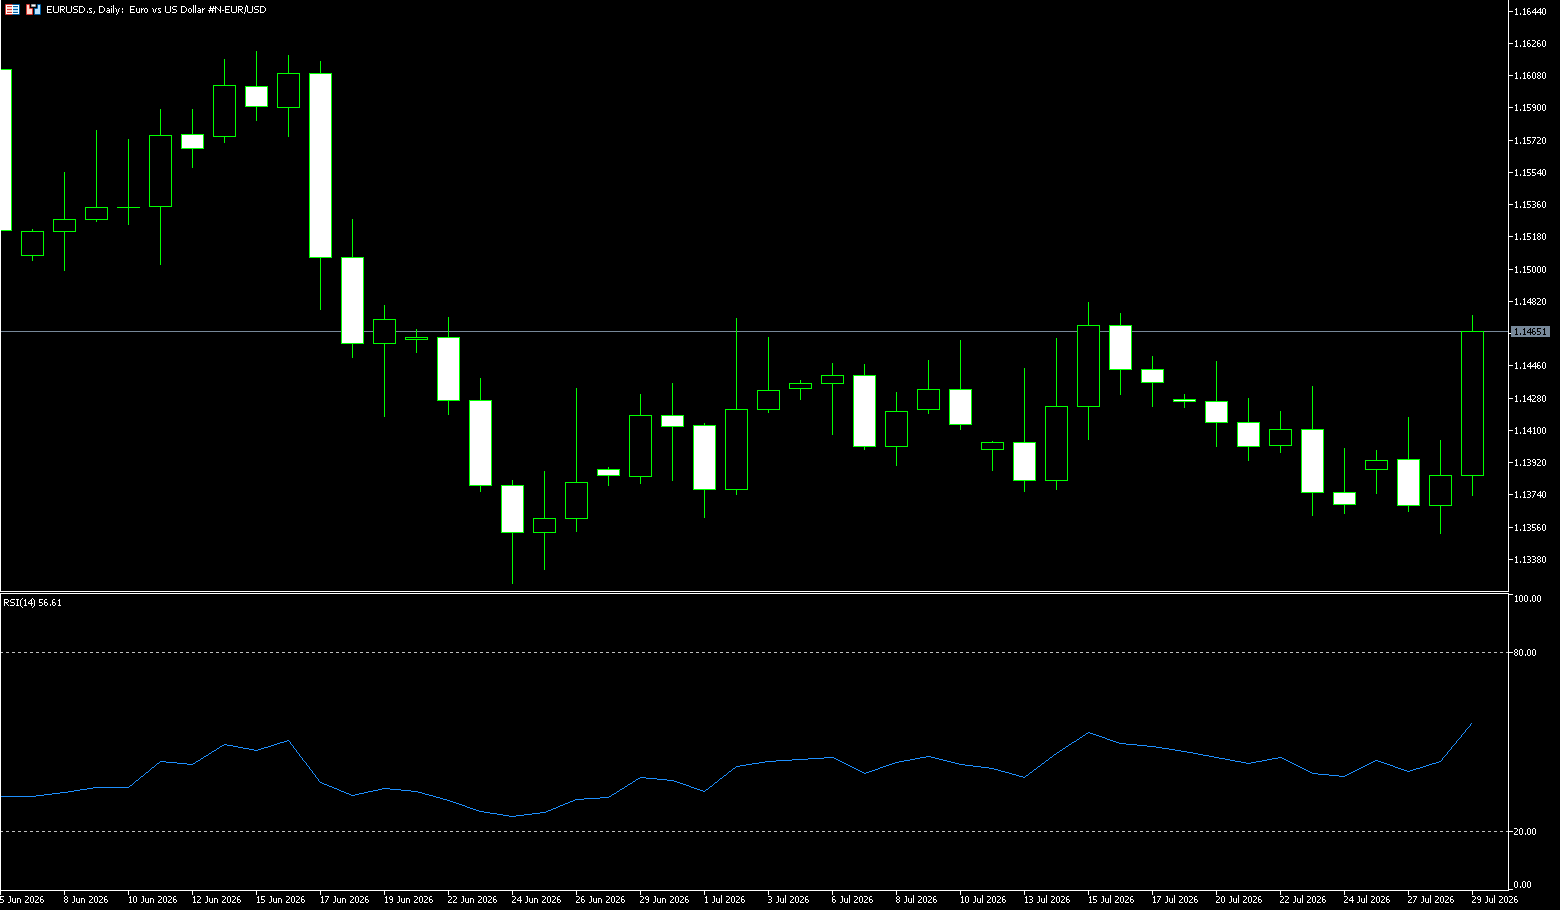
The euro/dollar pair traded at a new weekly high above 1.1450 after the Federal Reserve decided to keep interest rates unchanged. The statement showed that policymakers remained confident in economic progress while blaming inflation on energy prices. The divergent vote among officials cast doubt on a September rate hike, causing a sharp drop in the dollar. The ceasefire between the US and Iran and the pullback in oil prices provided some breathing room for the euro. However, the euro's upside potential is limited by multiple factors: the market has priced in an 81% rate hike in September, meaning the dollar's interest rate support has not disappeared; concerns about global oil supply disruptions persist, and inflation risks continue to support the dollar; the Eurozone's own economic growth prospects remain constrained by high interest rates and geopolitical risks. The euro fell below $1.14, hitting a one-month low, although the pause in the US attack on Iran lowered oil prices and eased inflation concerns, US Treasury yields only slightly declined, reflecting continued caution.
In the short term, the euro's movement around the 1.140 level will depend on the wording of the FOMC statement and marginal changes in the Middle East situation. Before these two variables become clearer, the euro is more likely to consolidate within the 1.1324 (June 24 low) - 1.1450 (July 20 high) range. Only then can the technical structure shift from weak consolidation to equilibrium. The MACD indicator remains below the zero line, and although the histogram has slightly turned positive, it is more likely that the downward momentum has temporarily weakened than that the trend has reversed. For traders, Thursday's FOMC decision is the real highlight of the week—before that, any directional bets are likely to face two-way risks. If the Fed is more hawkish than expected, the euro could fall below 1.1324 and accelerate its decline to 1.1300; if it is less hawkish than expected, the euro could rebound to above 1.1500 (the psychological level) and 1.1450 (the July 20 high).
Consider going long on the euro today at 1.1440, with a stop loss at 1.1430 and targets at 1.1490 and 1.1495.
Stock Analysis:
Australian ASX 200 Stock Index
Basic Market Overview:
The Australian ASX 200 index rose 91 points, or 1.0%, to close at 9,039 on Wednesday, marking its third consecutive day of gains and reaching its highest level since early March. Dovish consumer price index data eased pressure on the Reserve Bank, which has already raised interest rates three times this year. However, gains were limited by weakness in US stock index futures due to a surge in oil prices following Iran's attack on US troops. Meanwhile, investors cautiously awaited the Federal Reserve's interest rate decision and Chairman Kevin Warsh's briefing later in the day. Almost all sectors rose, with healthcare, retail, consumer services, and non-durable consumer goods leading the gains.
Rio Tinto shares rose 3.7%, driven by its strongest first-half results in four years and its largest interim dividend since 2022. CSL shares surged 7.2% after announcing a trial of a new immunoglobulin production process. Woodside Energy shares rose 1.4% on a 28% increase in second-quarter revenue and a narrowing of full-year guidance. In contrast, three of the four major banks performed modestly, with only ANZ Group posting a gain of 1.4%.
Sector Performance:
Leading Sectors (Closing Change)
1. Healthcare XHJ +4.20% [Strongest Performer]
2. Leading Stocks: CSL (+7.15%), ResMed (RMD) +3.59%, Sonic Healthcare (SHL) +3.2%
Driven by: Long-term assets benefiting from declining yields; positive news from CSL's new technology boosting sector sentiment.
3. Consumer Discretionary XDJ +2.37%
Leading Stocks: Lovisa (LOV) +7.88%, Temple & Webster (TPW) +8.36%, JB Hi-Fi (JBH) +4.67%
Logic: Rising expectations of interest rate cuts; valuation recovery in the retail and home consumer sectors.
4. Consumer Staples (XLP) +1.98%
Coles and Woolworths both rose, driven by defensive characteristics and improved interest rate expectations.
5. Communication Services +1.50%, Materials +1.12%, Information Technology +1.08%
Materials Highlights: Rio Tinto (RIO) surged; Xero (XRO) +4.11% boosted the technology sector.
Weakest Performers/Lowerers (No sectors closed lower, overall gains were broad, only relatively underperforming the broader market)
1. Financials (XFJ) +0.19% [Weakest Performer]
The four major banks significantly underperformed the market, with CBA, WBC, and NAB showing slight gains; only ANZ was relatively strong. Market Interpretation: Interest rate cut expectations are suppressing the outlook for bank net interest margins.
2. Utilities +0.25%, Industrials +0.48%
Slight gains, significantly lower than the market average.
Technical Analysis:
The Australian Securities Exchange 200 Index closed at 9038.6 points (+1.01%) on Wednesday, marking its third consecutive day of gains and firmly establishing itself above the 9000 mark, reaching a new high since March. Technically, it has broken out of the long-term 8500-9000 range since April, opening up upward potential. However, the breakout was not followed by a surge in volume, so caution is advised against a false breakout followed by a pullback for confirmation. If the index effectively breaks above the 50-day and 200-day moving averages, the medium-term trend will shift from consolidation to a bullish bias. The RSI (14) indicator has risen to the 68 range, approaching overbought territory, indicating some depletion of bullish momentum and a potential short-term technical pullback. The MACD indicator shows a continued golden cross above the zero line, with the red bars continuing, but the increase in bar size is slowing. The medium-term bullish pattern is established. In the short term, the price is consolidating at a high level after the breakout, and the RSI is approaching overbought territory. It is not advisable to chase the price directly; instead, wait for a pullback to confirm support.
Trading Strategies:
The following are technical trading ideas only and do not constitute investment advice. Leveraged trading may result in losses exceeding the principal.
Bull Strategy (Prioritize waiting for pullbacks, avoid chasing highs)
1. Conservative Long Position: Enter when the price pulls back and stabilizes within the 9000-9020 support range; stop loss below 8935; target 9085 → 9150, break above for 9200.
2. Aggressive Long Position: Enter only after a strong break above 9090 with significant volume; stop loss at 9030, strictly control position size.
Bear Strategy (Playing the short-term pullback, try shorting with a small position)
1. Shorting at resistance levels: If the price rebounds to the 9080-9100 range and encounters resistance, and the candlestick shows a stall signal (long upper shadow), consider a small short position; stop loss above 9135; target 9020, break below for 8940.
Key Risk Warnings:
Federal Reserve Interest Rate Decision (Core Risk)
If the Fed releases a hawkish signal, global risk assets will be under pressure, and Australian stocks are likely to follow suit with a rapid correction, potentially invalidating the breakout pattern.
Breakout Validity in Doubt
Although the closing price is above 9000, the earnings season continues, individual stock performance is diverging, and there is significant profit-taking pressure. Be wary of a pullback to test support at 9000; a decisive break below 9000 would signal the failure of this breakout and a return to range-bound trading.
RPA Interest Rate Expectations Remain Fluctuating
Inflation data is only a single reading. If subsequent employment data is strong, the market will reprice interest rate hike expectations, suppressing the stock market, consumer goods, and real estate.
Hong Kong Hang Seng Index
Basic Market Overview:
The Hang Seng Index rose 1.96%, or 497 points, to close at 25,808 on Wednesday, a new high in eight weeks, driven by continued gains in technology stocks. Investor sentiment improved as concerns about AI-related valuations eased, while the market positioned itself ahead of the Federal Reserve's policy decisions and earnings reports from major U.S. tech companies. Investor sentiment was also bolstered by reports that fast-fashion giant Shein planned a Hong Kong IPO with a valuation target of $40 billion to $50 billion, boosting confidence in Hong Kong's capital markets.
Meanwhile, renewed geopolitical tensions in the Middle East kept oil prices high, raising concerns about inflation and interest rate prospects. Despite these headwinds, bargain hunting helped support regional stock markets, particularly tech stocks. Notable stocks included Tencent (4.3%), Xiaomi (9.0%), Meituan (2.2%), Pop Mart International (2.2%), and Ctrip (5.1%).
Sector Performance:
Leading Sectors (from strongest to weakest):
1. Automobiles / New Energy Vehicles [Strongest Overall]
Representative Stocks: Li Auto - W (+9.90%), Leapmotor (+9.50%), Chery Automobile, Geely Automobile, XPeng Group; Improved passenger vehicle sales data drove the sector's rebound.
2. Internet Technology Platform Stocks
Xiaomi Group - W (+8.95%), Tencent Holdings (+4.29%), Bilibili, Ctrip, Meituan, Alibaba Health.
3. Food & Beverage / New Consumption
Consumer stocks such as Bruker, Mixue Group, Weilong Delicious, and Modern Farming rebounded.
4. Media, Gaming, AI Robotics Concepts
MINIMAX-W, Horizon Robotics, and Meitu performed strongly.
Leading Declining Sectors (Weak Overall)
1. PCB Copper Clad Laminates, Memory Chips, Semiconductor Equipment (Largest Decline): Xinge Microelectronics (-15.80%), Shenghong Technology (-7.90%), Kingboard Laminates, GigaDevice; some AI industry chain stocks saw profit-taking.
2. Optical Communication, Fiber Optic Cable: Yangtze Optical Fibre and Cable, Cambridge Technology continued to weaken.
3. Some Semiconductor Manufacturing Stocks: Huahong Grace Semiconductor, SMIC performed weakly, showing a clear divergence from the automotive and internet sectors.
Technical Analysis:
The Hang Seng Index opened higher and continued to rise throughout the day, with almost no deep pullback. It opened at 25487, reached a low of 25487, and a high of 25808, exhibiting a one-sided upward trend. The Hang Seng Index closed at 25807.92 points, +1.96% (+497.07 points). The daily chart closed with a large bullish candle, breaking through the previous consolidation range with increased volume and effectively holding above the 25300 level, a short-term support/resistance level, ending several days of narrow-range trading and significantly restoring short-term bullish sentiment. On the 4-hour chart: the price continues to rise along short-term moving averages, which are in a bullish alignment; the RSI indicator has entered a high-level range, approaching overbought territory, indicating potential profit-taking in the short term; the MACD histogram above the zero line continues to expand, strengthening bullish momentum, but the risk of bearish divergence is gradually accumulating; regarding moving averages, the 5/20/50-day moving averages have turned upwards, shifting the medium-term trend from consolidation to a slightly bullish bias. The index has successfully broken through the consolidation range, strengthening the short-term trend. However, the rapid short-term rise and the indicators entering high levels make a direct, continuous, and violent surge more difficult. The market is likely to switch to a pattern of "surge + high-level consolidation to digest profit-taking," leading to increased volatility.
Trading Strategy:
This information is for market analysis and reference only and does not constitute any trading or investment advice.
Short-term bullish strategy (trend-following strategy)
• Consider a small long position if the price retraces to the 25530-25580 range and stabilizes.
• Stop loss: Exit if the price breaks below 25310.
• First target: 25920-25950; a break above this level targets 26100-26200, with profit-taking in stages upon reaching these levels.
Short-term strategy under pressure (only suitable for aggressive traders)
• Consider a very small short position to speculate on a pullback if the price rallies to the 25920-25950 range and the volume shrinks.
• Stop loss: Exit if the price holds above 26000.
• Target: 25600 → 25530
Key risk warnings:
1. Macro liquidity risk (the biggest influencing factor): The Hang Seng Index is an offshore market, highly correlated with US Treasury yields and expectations of Fed rate cuts. 1. **2. **Capital Structure Risk:** While the index surged today, southbound capital continued to flow out, indicating the rebound was driven by foreign investment. If foreign buying slows and domestic capital fails to follow suit, the sustainability of the rebound is questionable.
3. **Technical Correction Risk:** After a rapid short-term rise, the RSI has entered a high level, accumulating a large amount of short-term profit-taking. A rapid one-day pullback is highly likely, so avoid chasing the rally at high levels.
Disclaimer: The information contained herein (1) is proprietary to BCR and/or its content providers; (2) may not be copied or distributed; (3) is not warranted to be accurate, complete or timely; and, (4) does not constitute advice or a recommendation by BCR or its content providers in respect of the investment in financial instruments. Neither BCR or its content providers are responsible for any damages or losses arising from any use of this information. Past performance is no guarantee of future results.
More Coverage





Risk Disclosure:Derivatives are traded over-the-counter on margin, which means they carry a high level of risk and there is a possibility you could lose all of your investment. These products are not suitable for all investors. Please ensure you fully understand the risks and carefully consider your financial situation and trading experience before trading. Seek independent financial advice if necessary before opening an account with BCR.
BCR Co Pty Ltd (Company No. 1975046) is a company incorporated under the laws of the British Virgin Islands, with its registered office at Trident Chambers, Wickham’s Cay 1, Road Town, Tortola, British Virgin Islands, and is licensed and regulated by the British Virgin Islands Financial Services Commission under License No. SIBA/L/19/1122.
Open Bridge Limited (Company No. 16701394) is a company incorporated under the Companies Act 2006 and registered in England and Wales, with its registered address at Kemp House, 160 City Road, London, England, EC1V 2NX. Open Bridge Limited acts solely as a payment processor for BCR Co Pty Ltd and does not provide any financial, trading, or investment services on its behalf. Open Bridge Limited's role is limited to payment processing.


 English
 简体中文
简体中文
 繁體中文
繁體中文
 Bahasa
Melayu
Bahasa
Melayu
 Tiếng
Việt
Tiếng
Việt
 ไทย
ไทย
 日本語
日本語
 한국어
한국어
 ភាសាខ្មែរ
 español