


0
Currency & Commodity Analysis:
US Dollar Index
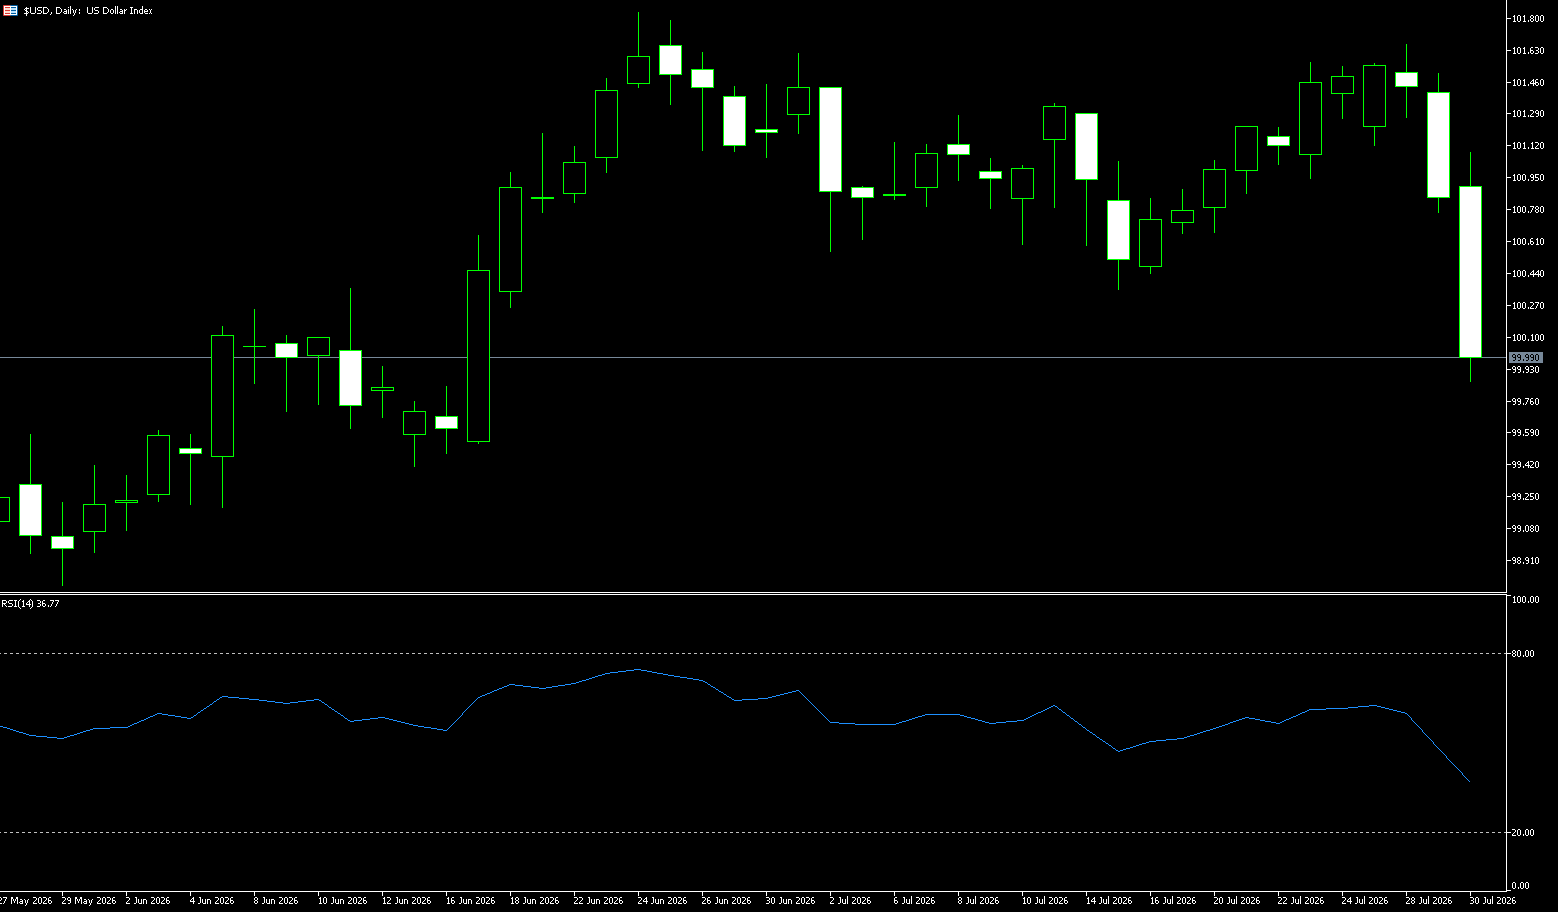
The US dollar weakened across the board during the week, with the dollar index falling slightly below 100. This was primarily due to the Federal Reserve maintaining interest rates at 3.50%-3.75%, but three policymakers voted to raise rates, highlighting internal disagreements about inflation risks and exacerbating market doubts about Chairman Warsh's ability to achieve the 2% inflation target. On Thursday (July 30), the dollar index briefly fell below 100, hitting a new low since June 17, before rebounding slightly and currently trading around 100. Overnight, the Fed voted 9-3 to keep interest rates unchanged, maintaining the target range for the federal funds rate at 3.50%-3.75%. Three hawkish members voted against a 25 basis point rate hike—the most public dissent within the FOMC in recent years, highlighting deep disagreements on policy direction. Interest rate expectations subsequently adjusted rapidly. According to the latest data from CME's "FedWatch," the market's probability of keeping interest rates unchanged in September has risen from 23.4% before the decision to 42.6%, while the probability of a rate hike of at least 25 basis points has fallen from 76.6% to 57.4%. This correction in expectations is driving a repricing of the dollar index.
The dollar index fell below the 101-100 low mid-week. Despite hawkish dissenting votes, the decision to maintain the current level raised doubts about whether enough policymakers would support a rate hike at the September meeting. The immediate market reaction also pushed down US Treasury yields and triggered a broad sell-off of the dollar. Currently, the dollar index faces resistance at the 101.00 level, which was just breached. A rebound above this level at the daily close would suggest this move was merely noise. Above that, the 100.50 area (50-day simple moving average) limits the potential for resistance at the session high. Then, the 100.85 area marks the session high. Below, 99.49 (the low of June 17th) is the first support level, while the 99.00 level is the key level.
Today, consider shorting the US Dollar Index at 100.10, with a stop loss at 100.20 and targets at 99.70 and 99.60.
WTI Crude Oil
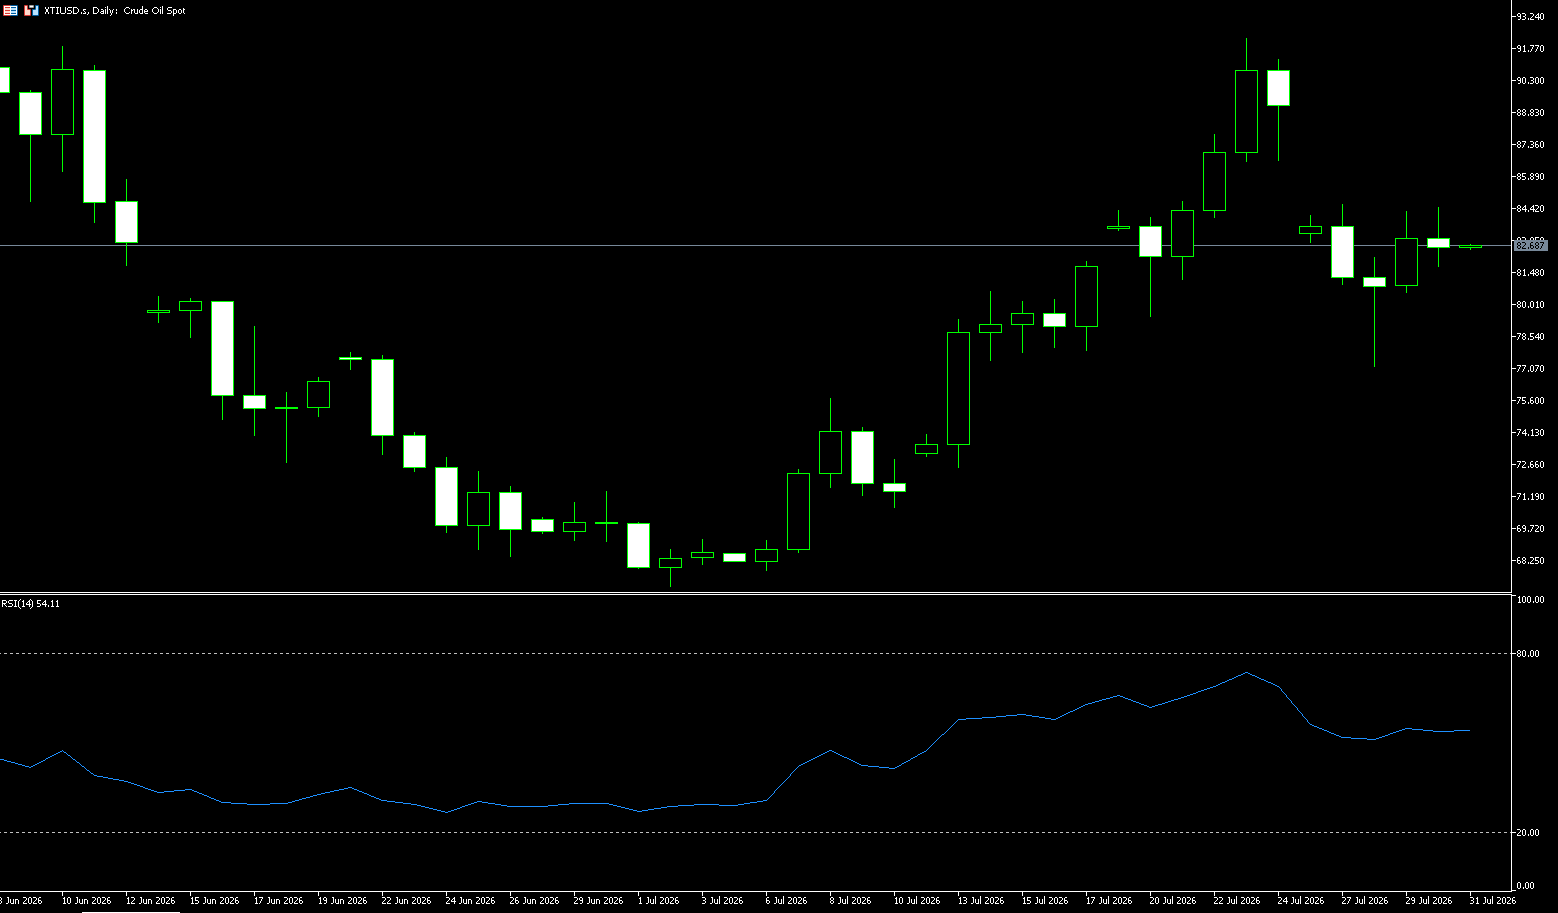
Crude oil prices fell nearly 1% on Thursday, dropping below $83 a barrel, after rising 6.6% in the previous session. Despite ongoing conflict in the Middle East, signs of improved shipping activity in the Strait of Hormuz and continued diplomatic efforts eased regional tensions. According to Kpler data, 14 commodity ships passed through the Strait of Hormuz in both directions on Wednesday, an increase from the daily volume last week. Qatar also shipped its first liquefied natural gas cargo through the waterway, while reports surfaced that Saudi Arabia proposed forming a naval alliance to protect key trade routes. Meanwhile, high crude oil inventories in China continued to pressure import demand, further easing concerns about near-term supply tightness. However, geopolitical risks remain high following the US military strikes on dozens of Iranian military targets to weaken Tehran's ability to threaten regional shipping and US allies.
In the short term, the escalating geopolitical conflict cycle remains unresolved, and crude oil and safe-haven assets are likely to maintain high volatility. The impulse for WTI oil prices to challenge the $90 mark is objectively present, and shipping costs will remain high. However, it must be clearly recognized that this is a market extremely reliant on headlines: once there are signs of substantial diplomatic mediation or restraint from both sides, the magnitude of the premium retracement could be equally dramatic. In the long term, the negative feedback from high oil prices needs to be guarded against. If the situation in the Middle East leads to a prolonged period of high oil prices, it will further increase global inflationary pressures, delay the interest rate cuts by major central banks, and thus suppress global macroeconomic recovery and actual crude oil demand, ultimately creating a top-down pressure on oil prices. Technically, support levels for oil prices are at $80.00 (a psychological level) and the 38.2% Fibonacci retracement level of $79.48, while resistance levels are at the $85.00 level and the $88.13 area (the 100-day moving average). Currently, attention is focused on whether prices break through these two levels; currently, the market is in a range-bound phase, with bulls and bears locked in a stalemate.
Today, consider going long on crude oil at 82.50, with a stop loss at 82.35 and targets at 85.00 and 84.00.
Spot Gold
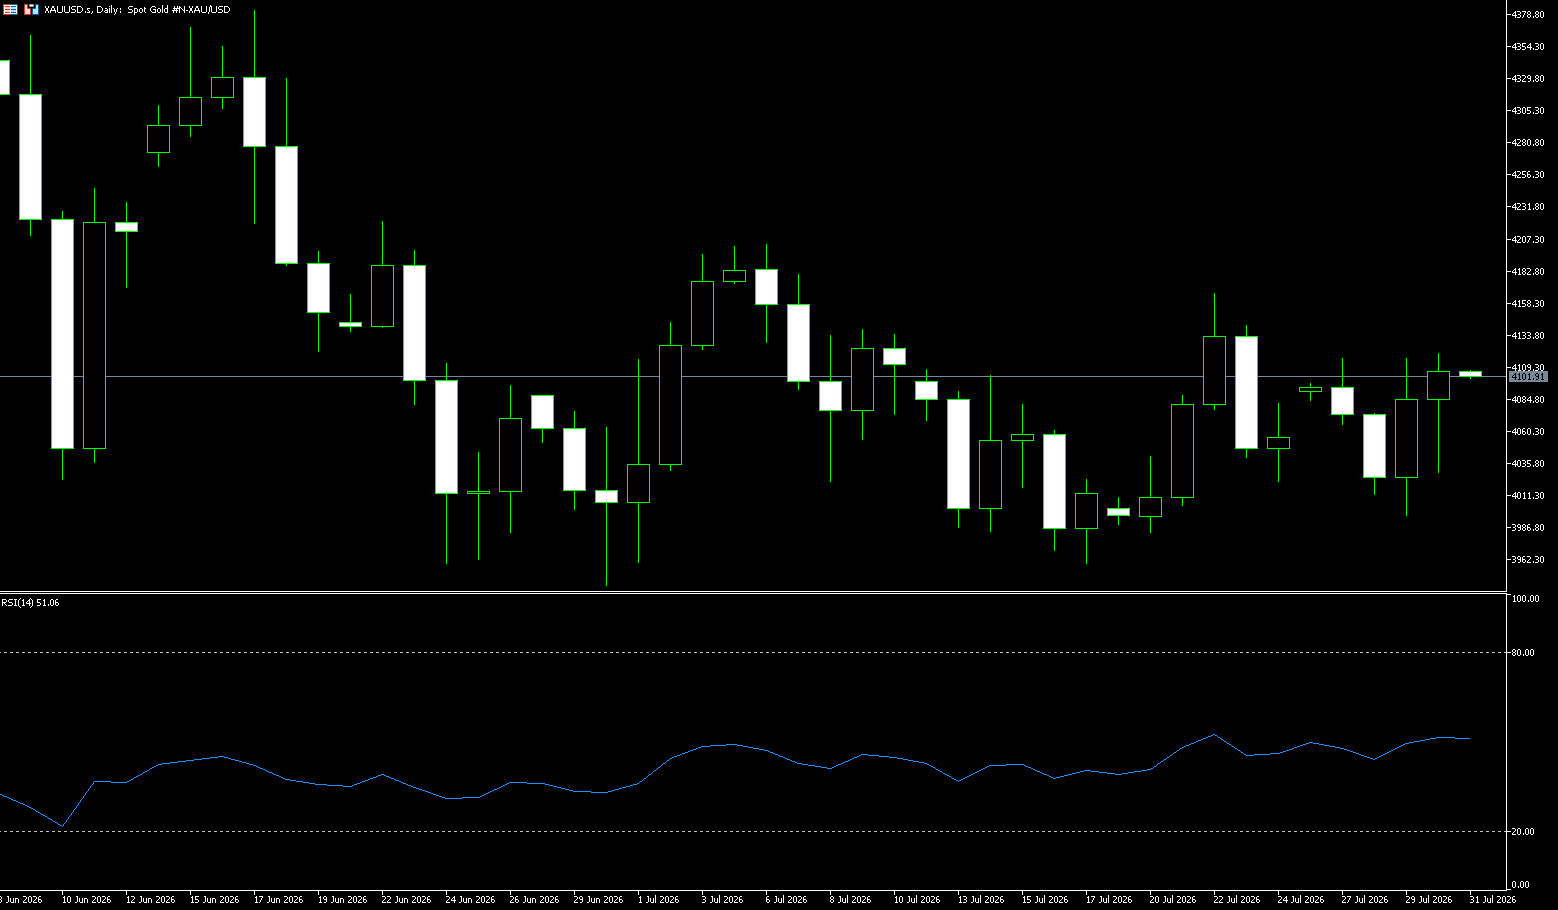
Gold rose above $41,000 an ounce on Thursday, extending Wednesday's 2% gain, supported by a weaker dollar and as investors assessed the Federal Reserve's decision to keep interest rates unchanged and focused on escalating tensions in the Middle East. The Fed kept interest rates at 3.50%-3.75%, with Chairman Kevin Warsh reiterating the central bank's commitment to curbing inflation. Meanwhile, the US military stated that it had struck dozens of Iranian Islamic Revolutionary Guard Corps targets after Tehran launched ballistic missiles at US forces in Jordan, raising concerns about renewed inflationary pressures. While gold is widely viewed as a safe-haven asset against inflation and geopolitical uncertainty, expectations of persistently high interest rates tend to put pressure on this non-yielding metal. The market currently estimates a roughly 60% probability of a Fed rate hike in September. Additionally, the World Gold Council reported an increase in unofficial gold inflows into India since the country raised import tariffs earlier this year.
Geopolitical situations have a two-way impact on gold: geopolitical crises fuel safe-haven demand, which is beneficial for gold; however, rising oil prices will push up inflation expectations, supporting higher US Treasury yields and thus limiting the upside potential of gold, a non-interest-bearing asset. If gold continues to hold above $4,000 (a psychological level) and $3,996 (this week's low), the short-term technical outlook will improve; once it breaks below $4,000-$3,996, the support level at $3,941.70 (June 30th low) will become a focal point again. The primary upside targets for the bulls are: re-establishing a foothold above $4,100; and a successful break above $4,116 (Wednesday's high) would target $4,166 (July 22nd high), followed by a challenge of $4,200.
Today, consider going long on gold at 4,097, with a stop loss at 4,090; targets: 4,150 and 4,160.
AUD/USD
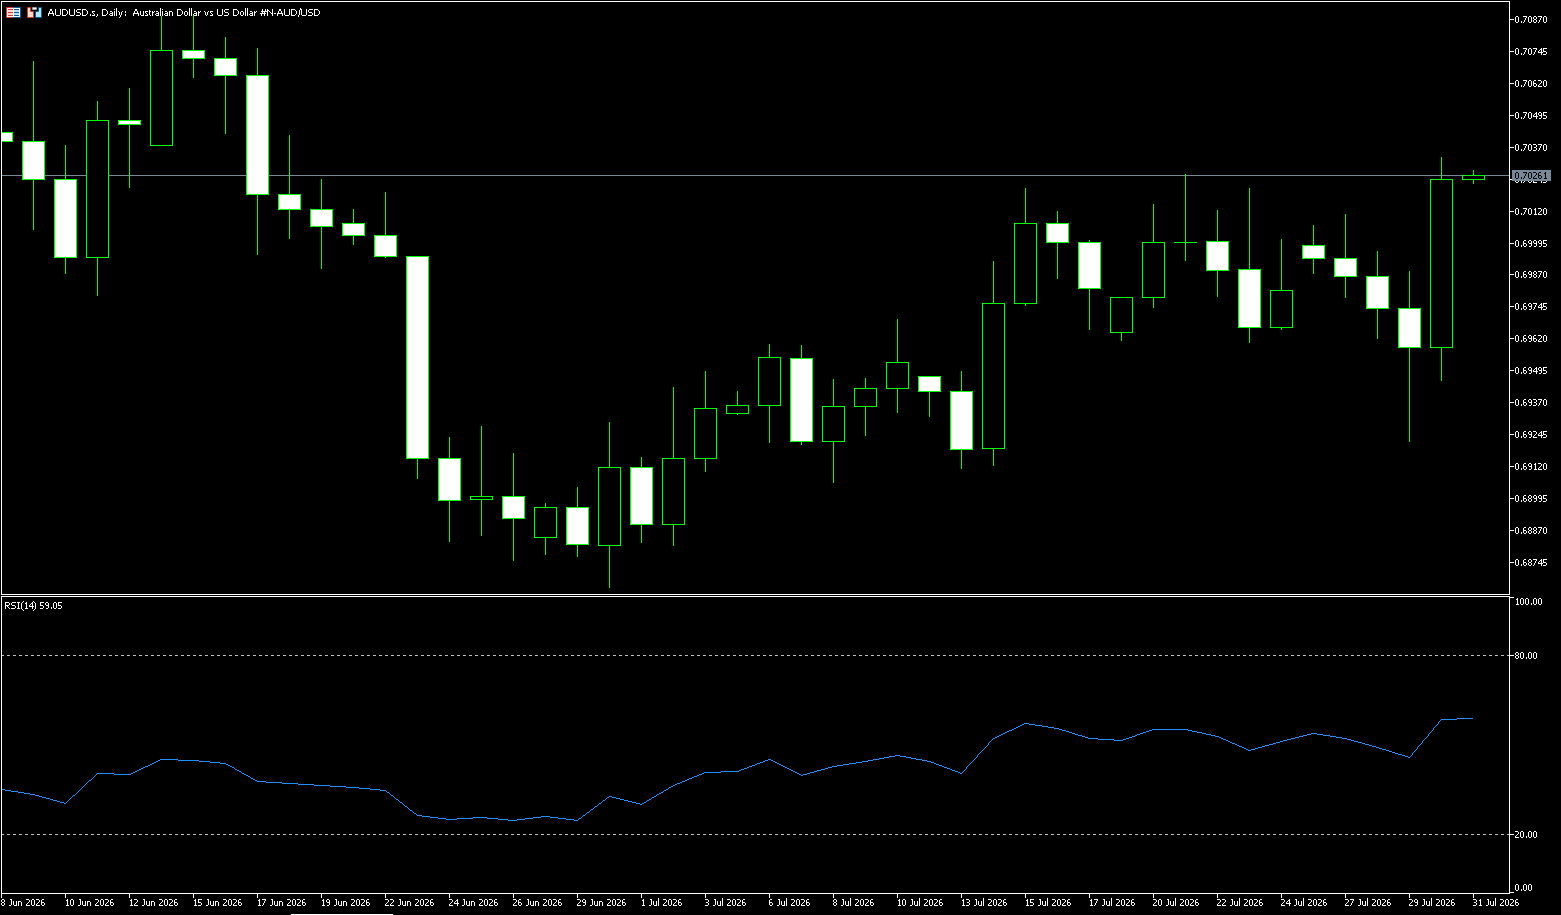
On Thursday, the AUD/USD pair traded around 0.7020, up 1% on the day, as a broad-based weakening of the US dollar offset the negative impact of slowing Australian inflation. Domestically, Australian inflation unexpectedly slowed to 3.8% in June (previous 4.0%, expected 4.0%), a four-month low. Market expectations for another RBA rate hike this year plummeted from over 90% before the data release to around 50%, and the 10-year government bond yield fell to 4.9%. Externally, the Federal Reserve voted 9-3 to keep interest rates unchanged, with three hawkish members dissenting. Warsh explicitly pledged at the press conference that he would "never waver in achieving the 2% inflation target." Amidst the interplay of two forces, the Australian dollar is seeking short-term equilibrium around 0.6960. Australia's overall inflation unexpectedly slowed to 3.8% in June, lower than the previous reading and market expectations of 4.0%, marking the lowest level since the outbreak of the Iraq War in February. Following this data release, market expectations for an August rate hike by the Reserve Bank of Australia (RBA) have largely dissipated, with the probability of another rate hike this year plummeting from over 90% to approximately 50%. The 10-year government bond yield subsequently fell to 4.9%, further weakening interest rate support for the Australian dollar.
The current focus in the foreign exchange market is on three key variables. The Reserve Bank of Australia's (RBA) August meeting signal is crucial. If the statement maintains a hawkish stance and hints at further tightening, it will strengthen support for Australian dollar interest rates and drive a short-term rebound. Meanwhile, expectations of further Fed rate hikes continue to dominate the US dollar's movement. If the market continues to price in a September rate hike, the US dollar index is expected to strengthen further, directly suppressing the Australian dollar. The Australian dollar is likely to consolidate within the 0.6900-0.7050 range. If the RBA releases an unexpectedly hawkish signal, the Australian dollar may rebound to above the 0.7052 (100-day moving average) - 0.7100 (psychological level); if the Fed continues to price in a September rate hike, the Australian dollar may fall below 0.6922 (Wednesday's low) and accelerate its decline towards the 0.6900 (psychological level). Until then, the tug-of-war between bullish and bearish factors is unlikely to break.
Consider going long on the Australian dollar at 0.7015 today, with a stop loss at 0.7005 and targets at 0.7060 and 0.7070.
GBP/USD
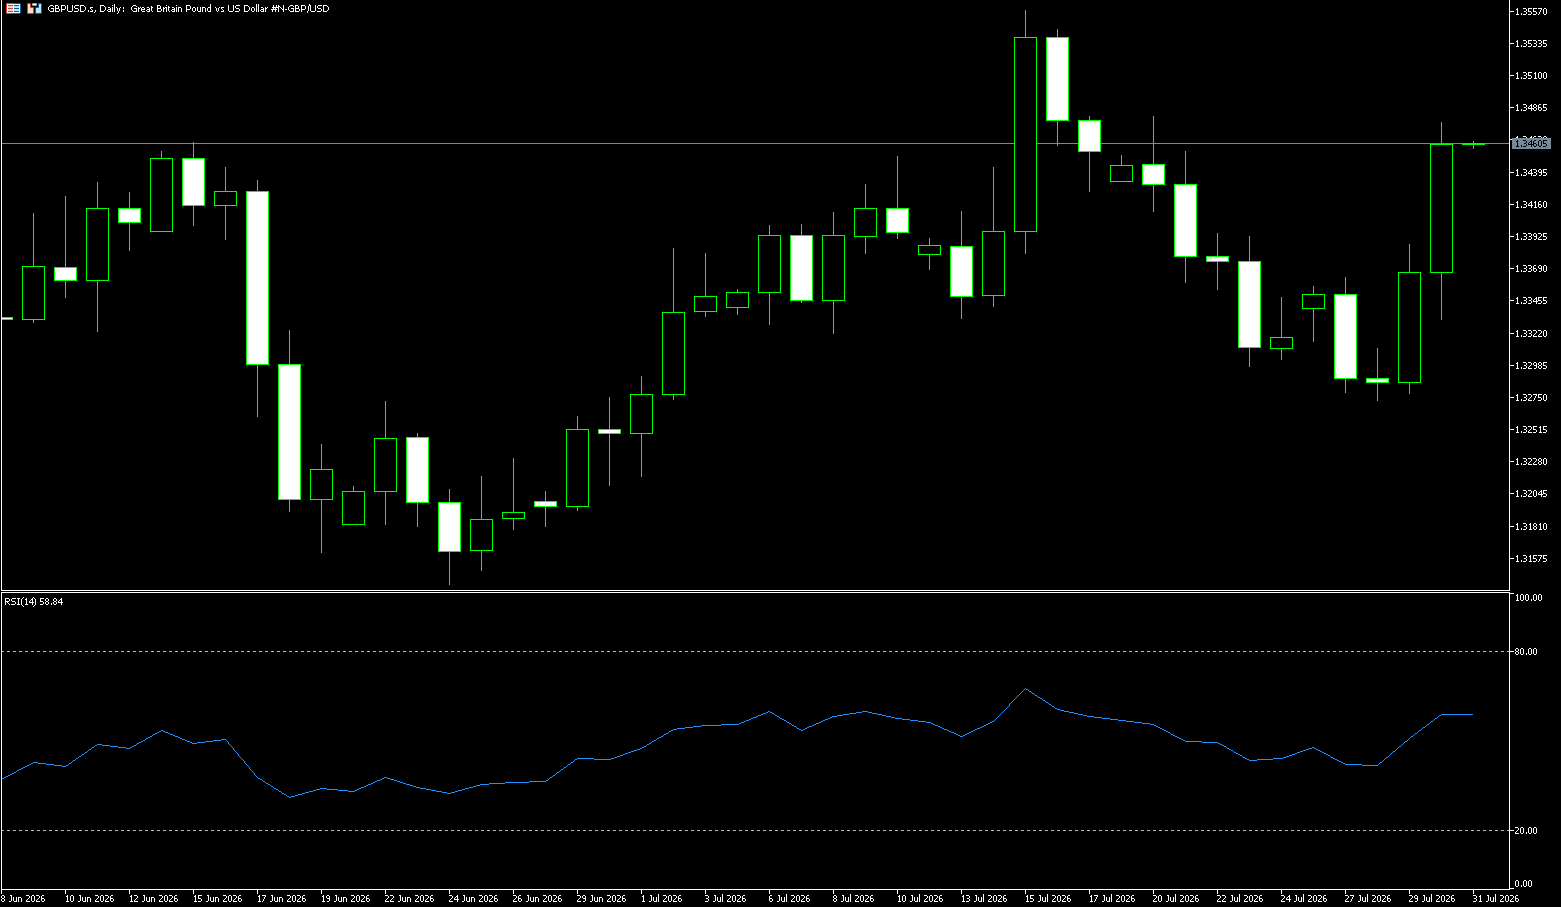
The pound gained positive momentum against the dollar on Thursday, breaking through 1.3450 and trading at a multi-week high. The Bank of England decided to keep the benchmark interest rate unchanged at 3.75%. The Monetary Policy Committee voted 6-3 to hold rates steady, with three dissenters supporting a rate hike. The weaker-than-expected US second-quarter GDP contributed to the pair's rise, while a general weakening of the dollar in the foreign exchange market further boosted the pair until the month-end close. The weaker-than-expected US second-quarter GDP helped maintain the stability of the pair. The pound/dollar pair struggled to capitalize on the previous day's strong rally to its weekly high. Spot prices are currently trading around 1.3460. The dollar regained some positive momentum after falling to a more than one-week low following the previous day's Fed meeting, becoming a key factor putting downward pressure on the pound/dollar pair. As widely expected, the Federal Reserve kept interest rates unchanged at the close of its two-day meeting on Wednesday. However, the central bank did not adopt a more aggressive monetary policy stance, which in turn put significant pressure on the dollar.
The pound traded around 1.3460 against the dollar, showing signs of stabilization. After retreating from its recent high of 1.3557, the pair has broken below several short-term moving averages. However, the current movement does not yet confirm a one-sided trend. The pair is near its recent low of 1.3273 while remaining far from its recent high of 1.3557, indicating that the market is awaiting new policy information to determine the direction of its movements. The MACD indicator reflects weak short-term momentum, and the previous appreciation driven by interest rate expectations is being compressed. Resistance: The exponential moving average band slightly below 1.3500 has been suppressing every rebound since mid-July, and the price is currently within it. A break above 1.3500 would target 1.3550, near the mid-July high. Support: The 1.3400 area, which was reclaimed today, is the first test of any pullback. Below it is the 20-day moving average at 1.3387.
Consider going long on GBP at 1.3453 today, with a stop loss at 1.3440 and targets at 1.3490 and 1.3500.
USD/JPY
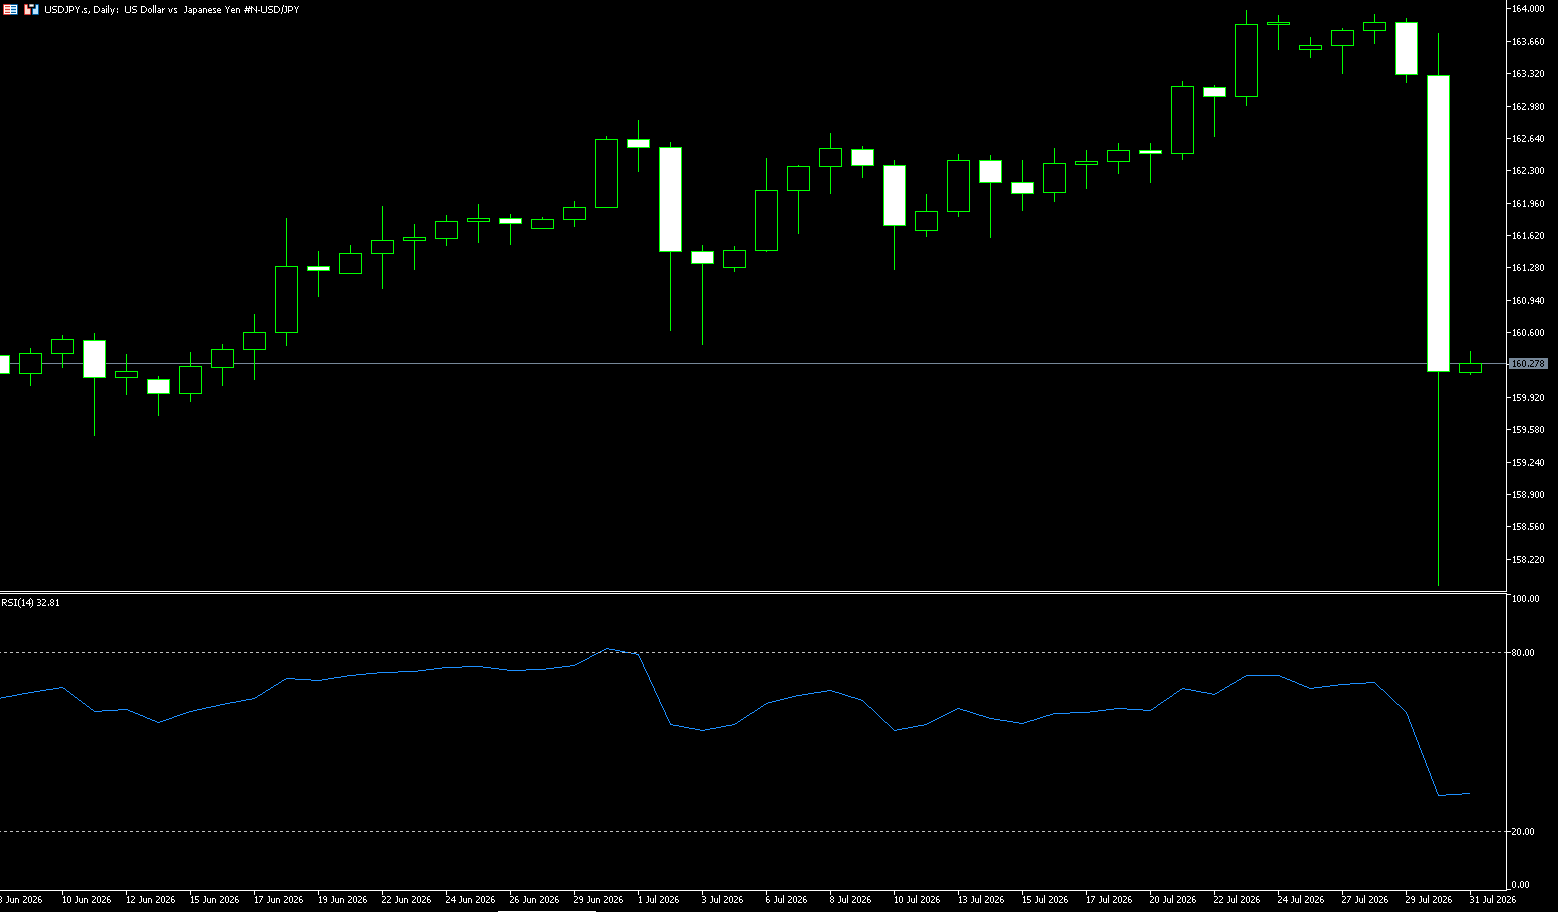
The yen broke through 160 yen per dollar on Thursday, rebounding from a 40-year low of 164 yen in the previous session, possibly due to intervention by the Treasury. This possible move comes after the Treasury sold $74.2 billion in the month ending May 27. This eased recent pressures from high energy prices, fiscal concerns, and excessive interest rate differentials. Increased dollar demand from energy importers in Japan due to soaring liquefied natural gas and gasoline prices caused by the Iran war has put pressure on economic growth due to lower profits, thus affecting the domestic currency. Meanwhile, fiscal concerns were exacerbated by the Domestic Tax Committee reiterating its proposal to cut the food tax from the current 8% to 1%, which increased the yen supply through new debt. Finally, the Bank of Japan is expected to keep interest rates unchanged tomorrow, following a rate hike in June. The Bank of Japan is expected to raise interest rates again this year, but the anticipated rate hikes by the Federal Reserve are limiting the narrowing of the interest rate differential.
Overall, the yen is currently caught in a tug-of-war between "long-term structural pressure" and "short-term event-driven rebounds": Resistance (downward): 157.98 (Thursday's low) - 155.04 (May 6th low). The large USD/JPY interest rate differential, coupled with the Bank of Japan's extremely cautious pace of rate hikes, has attracted carry trade funds to continuously build short positions (selling yen and buying dollars). Support (upward): The threat of official intervention at the 164.00-165.00 level, coupled with carry trade unwinding triggered by a US stock market correction, and the expectation of an October rate hike forcing short covering (buying yen and selling dollars). With increasing warnings from the Japanese Ministry of Finance, the risk of intervention reaching a critical point, and increased volatility in US stocks, investors need to be highly vigilant about the risk of a sharp pullback in the yen after its recent plunge, triggered by carry trade unwinding or a shift towards a hawkish policy stance.
Today, consider shorting the US dollar at 159.75, with a stop loss at 160.00 and targets at 158.50 and 158.00.
EUR/USD
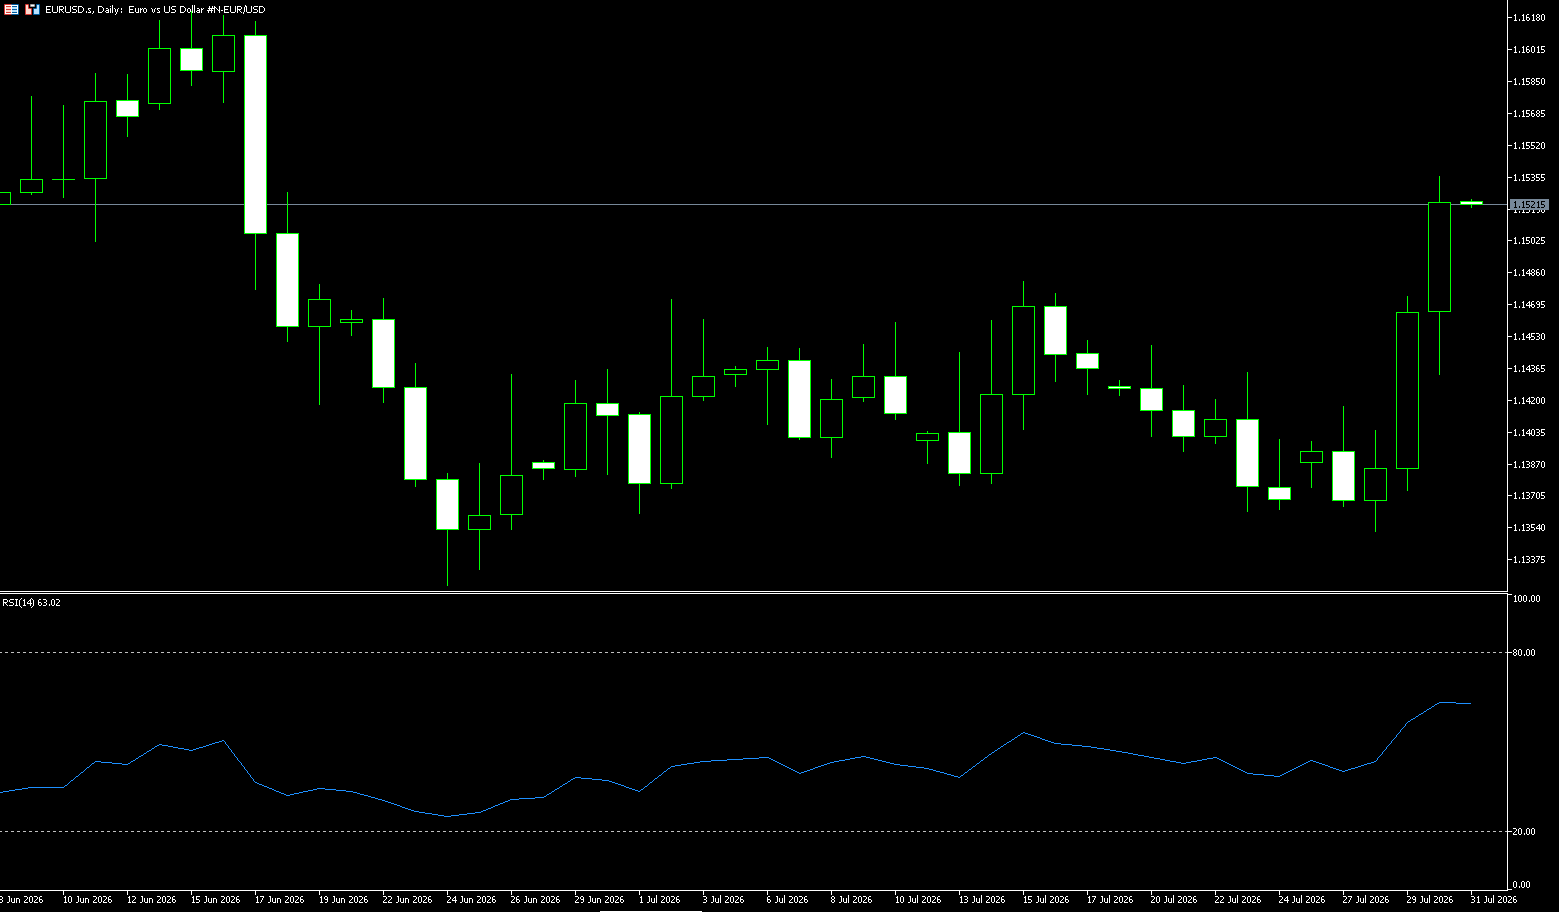
The euro/dollar pair traded around 1.1535 during Thursday's US session, hitting a six-week high. The dollar is under selling pressure, with multiple factors putting pressure on the US currency. US Q2 GDP also missed expectations. Suspected yen intervention further increased pressure on the dollar. The dollar strengthened slightly against the euro. The Federal Reserve decided to keep interest rates unchanged at 3.5%-3.75% at its July policy meeting on Thursday, despite widespread market expectations that the Fed would remain on hold. At the press conference, the Fed chairman stated that while the Fed would not reveal the direction of interest rate policy, it would take necessary measures to achieve its 2% inflation target. Reuters reported that financial markets believe the European Central Bank will raise interest rates at least twice more, with the first hike already fully priced in for October and the second for March.
From a technical perspective, the euro/dollar pair still faces further downside risk. On the daily chart, the currency pair is trading below the 100-day simple moving average at 1.1566. While it's above the 20-day simple moving average at 1.1417, its slope remains slightly downward, limiting its significance as support and continuing to indicate downward pressure in the short term. Meanwhile, the Relative Strength Index (RSI) is testing the 60 level, and the momentum indicator has turned downward but remains near the midline, suggesting continued selling pressure. On the downside, immediate support lies at the 50-day simple moving average at 1.1483; a break below this level would expose Thursday's low of 1.1434. On the upside, initial resistance is located in the 1.1567 area (the 100-day simple moving average), a long-term static resistance level, followed by the psychological level of 1.1600.
Today, consider going long on the Euro at 1.1510, with a stop-loss at 1.1500 and targets at 1.1567 and 1.1578.
Stock Analysis:
Australian ASX 200 Stock Index
Basic Market Overview:
The Australian Securities Exchange (ASX) 200 index fell 71 points, or 0.8%, to close at 8,968 on Thursday, ending a three-day rally and retreating to a near five-month high. Profit-taking followed Wednesday's plunge on Wall Street as traders weighed the impact of the Federal Reserve's decision to keep interest rates unchanged and three officials' support for a 25-basis-point rate hike. Geopolitical tensions increased pressure following Iran's raid on a US base in Jordan. Domestically, Reserve Bank of Australia Assistant Governor Sarah Hunt noted that overall inflation was slowing, although housing and service costs remained stubborn. Losses were widespread, with technology, logistics, retail, and non-energy mining sectors leading the decline.
Weaker iron ore and copper prices dragged down BHP Billiton (-1.4%) and Fortescue Metals (-0.9%). Gold mining companies saw sharp declines, with Northern Star Resources (-3.5%) and Evolution Mining (-2.8%) suffering heavy losses. Two of the Big Four banks saw declines between 0.5% and 0.8%. Conversely, Domino's Pizza shares surged 8.6% after confirming its annual profit outlook, despite a write-down.
Sector Performance:
Leading Sectors (Defying the Trend)
1. Energy
Driven by: Middle East geopolitical conflicts pushing up oil premiums; Ampol raising earnings expectations
Core Stocks: Ampol (+1.7%), Woodside Energy, Santos slightly up
2. Financials
The four major banks diverged, Westpac and National Australia Bank closed higher, while hedging insurance and investment banking sectors declined; the interest rate environment supported bank net interest margin expectations
3. Some Consumer Discretionary Sectors (Stock-Driven)
Domino’s Pizza (DMP) +9.08%, better-than-expected earnings guidance boosted consumer discretionary stocks in some areas
Leading Sectors (Mainly Dragging Down the Index)
1. Information Technology (Weakest Sector of the Day)
The sharp decline in US tech stocks spread, with most cloud and data center stocks weakening
Weak Stocks: Nextdc (-3.0%), Zip sharply down
Divergence: WiseTech Global bucked the trend, rising 6.67%
2. Basic Materials (Mining/ Materials (Gold)
Iron ore and copper prices weakened; the gold sector saw a significant pullback.
Weak stocks: BHP (-1.4%), Fortescue Metals, Northern Star Resources (-3.5%), Evolution Mining (-2.8%)
Divergence: Mineral Resources and PLS lithium mines bucked the trend and closed higher.
3. Utilities and REITs: Interest rate sensitive sectors, with profit-taking after continuous gains.
4. Consumer Staples and Logistics: Sectors that had seen significant gains previously saw profit-taking.
Technical Analysis:
The Australian Securities Exchange 200 index closed at 8968 points on Thursday, down 0.8% on the day, ending a three-day winning streak and retreating from the recent high of 9086. Medium-term trend: Slightly bullish with fluctuations; the index continued its upward trend in July, but encountered resistance after reaching 9086 on Thursday, forming a false breakout, indicating a significant weakening of short-term bullish momentum. Short-term structure: After three consecutive days of gains, profit-taking, coupled with overnight adjustments in US stocks and a hawkish signal from the Federal Reserve triggering a decline in risk appetite, has led the index into a short-term correction phase. Key technical indicators: RSI: Falling from overbought territory but not yet oversold, further downside potential remains; MACD: The bullish histogram is contracting, showing signs of turning downwards; The index has broken below the short-term 5-day moving average, shifting from a strong upward trend to a consolidation phase. Short-term neutral to bearish consolidation. Holding above 8900 will maintain the high-level consolidation pattern; a decisive break below 8900 would open the door to further correction towards the 8840-8700 range. Only a retest of 9086 can restart the bullish trend.
Trading Strategies:
The following are technical trading ideas only and do not constitute investment advice. Leveraged trading may result in losses exceeding the principal.
Bull Strategy (Buy on Dips, Be Cautious of Chasing Highs)
1. Ideal Buy Range: A small long position can be initiated around 8900 if the price stabilizes and closes positive.
Target: 9030 → 9086; Stop Loss: Below 8870
2. Aggressive Long Strategy: Chasing the price directly above 8960 is not recommended, as a false breakout carries significant risk.
3. Bullish Failure Condition: A daily closing price below 8900; abandon the long position strategy.
Bear Strategy (Sell on Resistance, Speculate on Dips)
1. Shorting Range: A rebound to 9020-9030 followed by resistance and stalling.
First Target: 8900; Second Target: 8840; Stop Loss: Above 9090
2. If the price breaks below 8900 decisively, add to the position targeting 8840.
Key Risk Warning External Risks
The Fed's hawkish expectations continue to push up US Treasury yields, suppressing global risk assets; Middle East geopolitical conflicts could disrupt risk appetite at any time; fluctuations in iron ore, copper, and gold prices directly impact the heavyweight mining sector; Australian dollar exchange rate fluctuations interfere with listed companies' earnings expectations.
Domestic Macroeconomic Risks
Australian inflation data remains resilient, and the market continues to price in the possibility of an RBA rate hike; the upcoming Australian earnings season presents uncertainty for resource and banking stock earnings guidance.
Technical Risks
If the 8900 support level is effectively broken, further downside potential will open up; conversely, if the 9085 high is quickly recovered, the challenge for the year's high of 9202 will resume.
New Zealand 50 Index (NZX50)
Basic Market Overview:
The New Zealand stock market fell 214 points, or 1.5%, to close at 13,763 on Thursday, mainly dragged down by the financial, healthcare, consumer goods, communication services, and materials sectors, as traders took profits after the index hit its third consecutive record high. Broader indices hit their lowest levels in over a week, following overnight declines on Wall Street after the Federal Reserve kept interest rates unchanged. Traders are anticipating the release of China's Purchasing Managers' Index (PMI) on Friday, with investors focusing on the economic conditions of New Zealand's major trading partners amid global economic uncertainty.
Positive readings of New Zealand business confidence prevented further declines, with sentiment rising to its highest level in five months, while moderate oil prices eased inflation concerns and expectations of interest rate hikes. The worst-performing stocks included Vulcan Steel (-6.1%), Ryman Healthcare (-4.3%), A2 Milk (-3.4%), Fisher & Paykel (-2.4%), and Auckland International Airport (-1.9%).
Sector Performance:
Leading Sectors (Contrarian Gains, Hedging Against Index Decline)
The overall market declined across the board, with few stocks rising. Only transportation (logistics/ports), some industrial stocks, and a small number of real estate stocks showed sporadic resistance. There was no strong leading sector:
• Transportation: Port of Tauranga and Mainfreight showed relatively strong resilience during the day, closing slightly lower than the broader market;
• A few industrial infrastructure stocks showed slight resilience;
Leading Sectors (Main Dragging Down the Index)
1. Healthcare (Largest Short-Selling Sector)
Representative Stocks: Ryman Healthcare -4.3%, Fisher & Paykel Healthcare -2.4%
2. Consumer Staples
Representative Stock: A2 Milk -3.4% (Leading Dairy Stock)
3. Materials
Representative Stock: Vulcan Steel -6.1% (Largest Declining Stock in the Entire Market)
4. Financials
ANZ, Westpac Across the board, the market sold off interest rate-sensitive assets as a safe haven.
5. Communication Services
The sector was generally under pressure.
Technical Analysis:
The NZX50 retreated from its highs on Thursday, entering a short-term corrective consolidation phase after the recent rise. The medium-term bullish structure remains intact, but chasing highs is not advisable in the short term. Current closing price: 13763 points, down 1.5% intraday. The pullback from recent historical highs indicates profit-taking by bulls, with a preference for waiting for pullbacks to support levels before buying. Short-term trading on pullbacks is possible if the rebound encounters resistance. Caution is advised until the range is broken, with key observation of the 13700 support level and the previous high of 13830. After recent consecutive new highs, a large bearish candlestick has appeared, indicating high-level stagnation and profit-taking pressure, suggesting a short-term consolidation phase. Technically, there are signs of divergence at high levels, suggesting a high probability of range-bound consolidation to digest gains, making a direct, one-sided new high more difficult. Technical Indicator RSI: The RSI has retreated from the overbought zone, moving away from above 70, indicating weakening bullish momentum, but it hasn't yet entered oversold territory. Currently, the index remains above the 5/10-day moving averages, and the medium-term uptrend is not yet broken, but the risk of a short-term pullback has increased. If the index continues to fluctuate narrowly between 13700 and 13800 without breaking through the upper or lower limits of the range, it is recommended to reduce positions and wait for a breakout before trading in the direction of the trend to avoid being stopped out repeatedly.
Trading Strategy:
This information is for market analysis and reference only and does not constitute any trading or investment advice.
Bullish Strategy (Buy on dips, follow the trend, avoid chasing highs)
• Ideal Entry: Consider going long if the price retraces to the 13700-13630 support zone and stabilizes with a reversal candlestick pattern.
• Stop Loss: Exit if the price breaks below 13550 (10-day moving average).
• Target: First target 13800; a break above this level targets the previous high of 13830, taking profits in batches if resistance is encountered.
Caution: Do not chase the price above 13800, as selling pressure is heavy at higher levels, and the risk-reward ratio is very poor.
Bearish Strategy (Playing the high-level pullback, only for short-term trading)
• Entry Condition: Consider going short if the price rebounds to the 13790-13830 range and stalls.
• Stop Loss: Exit if the price holds above 13850.
• Target: First target 13700; a break below this level targets 13630. Support
Note: The medium-term trend remains upward. Short positions are merely a correction and should not be held long-term.
Key Risk Warnings:
Monetary Policy Risk (Core Domestic Risk)
New Zealand's inflation remains above the central bank's target, and the market expects further interest rate hikes in September and December. Hawkish rhetoric could suppress stock market valuations, negatively impacting the NZX50.
External Macroeconomic Risks
1. China will release PMI data on Friday. New Zealand is highly dependent on exports to China, and the data directly affects export companies (A2 Milk, freight, manufacturing);
2. Expectations regarding Fed policy and overnight volatility in US stocks will significantly impact Oceania markets;
3. Middle East geopolitical tensions are pushing up oil prices, further increasing global inflation expectations and suppressing risk assets.
Technical Risks
A decisive break below the 13550 mid-term support level would signify the end of this upward trend, with a potential pullback to around 13400. Strict stop-loss orders are essential.
Disclaimer: The information contained herein (1) is proprietary to BCR and/or its content providers; (2) may not be copied or distributed; (3) is not warranted to be accurate, complete or timely; and, (4) does not constitute advice or a recommendation by BCR or its content providers in respect of the investment in financial instruments. Neither BCR or its content providers are responsible for any damages or losses arising from any use of this information. Past performance is no guarantee of future results.
Lebih Liputan






Pendedahan Risiko:Instrumen derivatif diniagakan di luar bursa dengan margin, yang bermakna ia membawa tahap risiko yang tinggi dan terdapat kemungkinan anda boleh kehilangan seluruh pelaburan anda. Produk-produk ini tidak sesuai untuk semua pelabur. Pastikan anda memahami sepenuhnya risiko dan pertimbangkan dengan teliti keadaan kewangan dan pengalaman dagangan anda sebelum berdagang. Cari nasihat kewangan bebas jika perlu sebelum membuka akaun dengan BCR.
BCR Co Pty Ltd (No. Syarikat 1975046) ialah syarikat yang diperbadankan di bawah undang-undang British Virgin Islands, dengan pejabat berdaftar di Trident Chambers, Wickham’s Cay 1, Road Town, Tortola, British Virgin Islands, dan dilesenkan serta dikawal selia oleh Suruhanjaya Perkhidmatan Kewangan British Virgin Islands di bawah Lesen No. SIBA/L/19/1122.
Open Bridge Limited (No. Syarikat 16701394) ialah syarikat yang diperbadankan di bawah Akta Syarikat 2006 dan berdaftar di England dan Wales, dengan alamat berdaftar di Kemp House, 160 City Road, London, England, EC1V 2NX. Open Bridge Limited bertindak semata-mata sebagai pemproses pembayaran untuk BCR Co Pty Ltd dan tidak menyediakan sebarang perkhidmatan kewangan, perdagangan atau pelaburan bagi pihaknya. Peranan Open Bridge Limited adalah terhad kepada pemprosesan pembayaran.


 English
 简体中文
简体中文
 繁體中文
繁體中文
 Bahasa
Melayu
Bahasa
Melayu
 Tiếng
Việt
Tiếng
Việt
 ไทย
ไทย
 日本語
日本語
 한국어
한국어
 ភាសាខ្មែរ
 español