


0
US Dollar Index
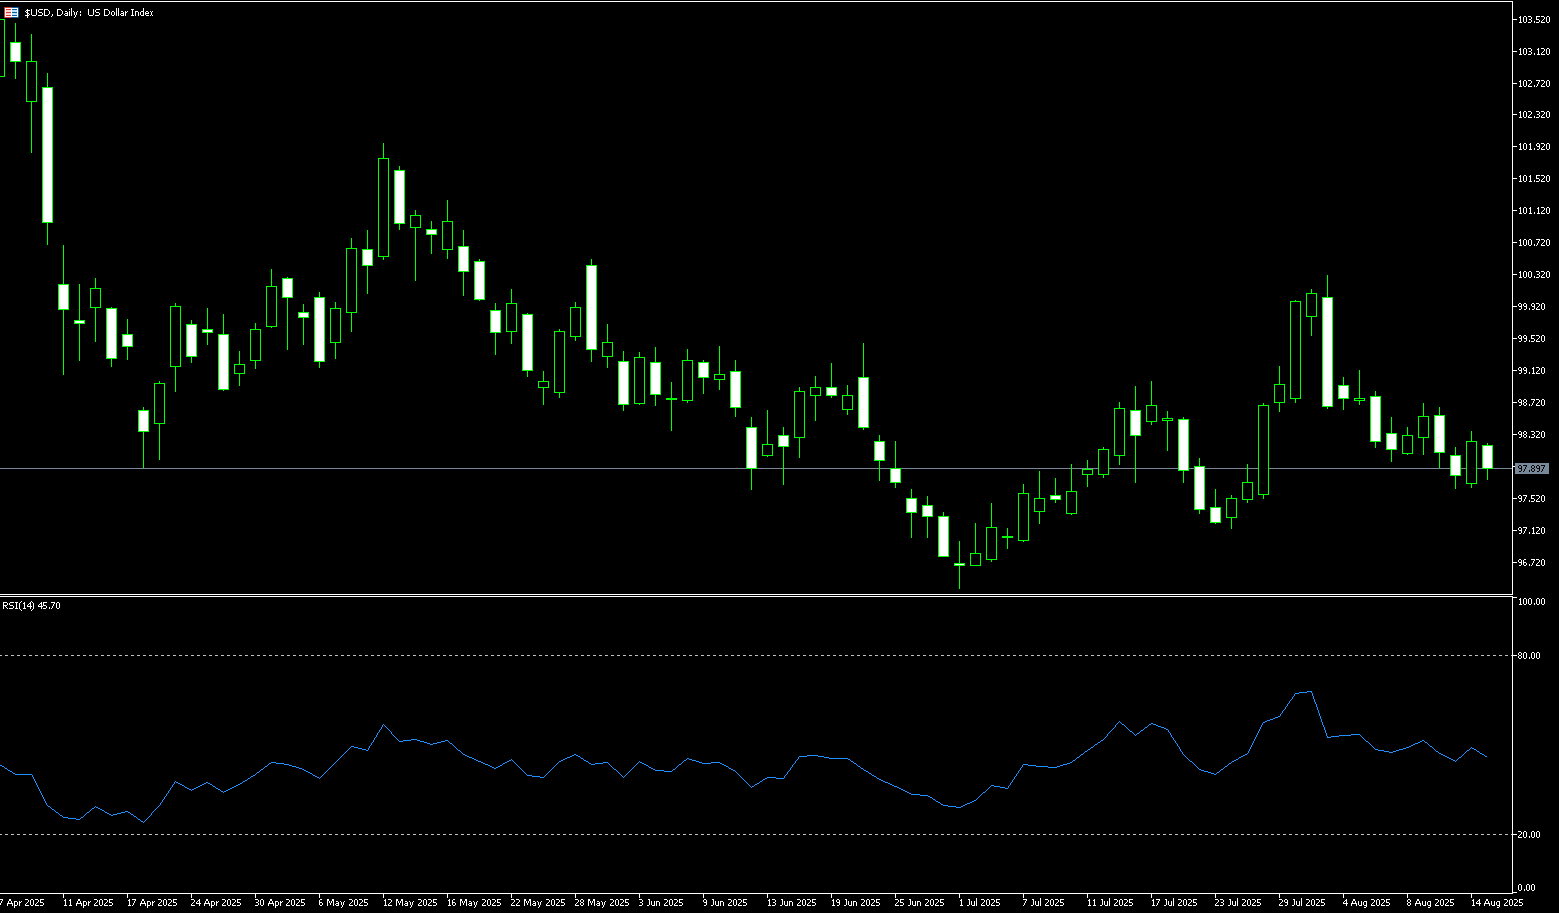
The US dollar index hovered near 98.00 before the weekend as a rise in US retail sales in July eased to 97.85, easing concerns about weak consumer spending. Sales rose 0.5%, driven by autos and online promotions, following a 0.9% increase in June. Excluding autos, sales rose 0.3%. Import prices rose 0.4%, defying expectations of a flat reading and raising concerns about potential inflation following a sharp rise in producer prices on Thursday. The market still sees a greater than 90% probability of a 25 basis point rate cut next month, but bets on a larger 50 basis point cut have been removed. Next week's Jackson Hole central bank symposium is expected to provide signals on future policy moves. Meanwhile, the Federal Reserve is facing increasing political pressure. Treasury Secretary Scott Bessant has publicly advocated for a "series of rate cuts," while President Trump has intensified his criticism of Fed Chairman Powell. The government has even proposed legal action over renovations to the Fed headquarters. Such political interference could undermine the central bank's credibility and further pressure the dollar. Technical breakdowns and a compressed yield curve further support the US dollar's near-term bearish outlook.
From a technical perspective, the US dollar index is currently trading at key support, forming a recent "double bottom" pattern with last Wednesday's low of 97.63. The US dollar index is currently trading below its 70-day moving average at 98.61, and is significantly away from its 100-day moving average (99.21) and 200-day moving averages (103.02), indicating a continued bearish medium-term trend. The breakdown of the 25-day moving average at 98.34 further reinforces the bearish signal. If this level cannot be quickly reclaimed in the short term, the US dollar index could continue to decline. The MACD indicator on the daily chart indicates that current market momentum favors the bears, suggesting that the overall trend remains dominated by bears. A break of the aforementioned "double bottom" at 97.63 could signal further declines for the US dollar index, potentially targeting the year-to-date low of 96.38. A break below this level could trigger a test of the psychologically important 95.00 level. Barring a major fundamental catalyst, the US Dollar Index will quickly reclaim the 70-day moving average resistance level of 98.60. This level has acted as resistance for several recent rebounds. If it breaks, the US Dollar Index could rise further towards the 99.00 round-figure mark and the 100-day moving average level of 99.22. The psychologically significant 100.00 level remains a key trend dividing line. If the US Dollar Index continues to move away from this moving average, the correction could be prolonged.
Today, consider shorting the US Dollar Index at 97.98, with a stop-loss at 98.10 and targets at 97.50 or 97.40.
WTI Spot Crude Oil
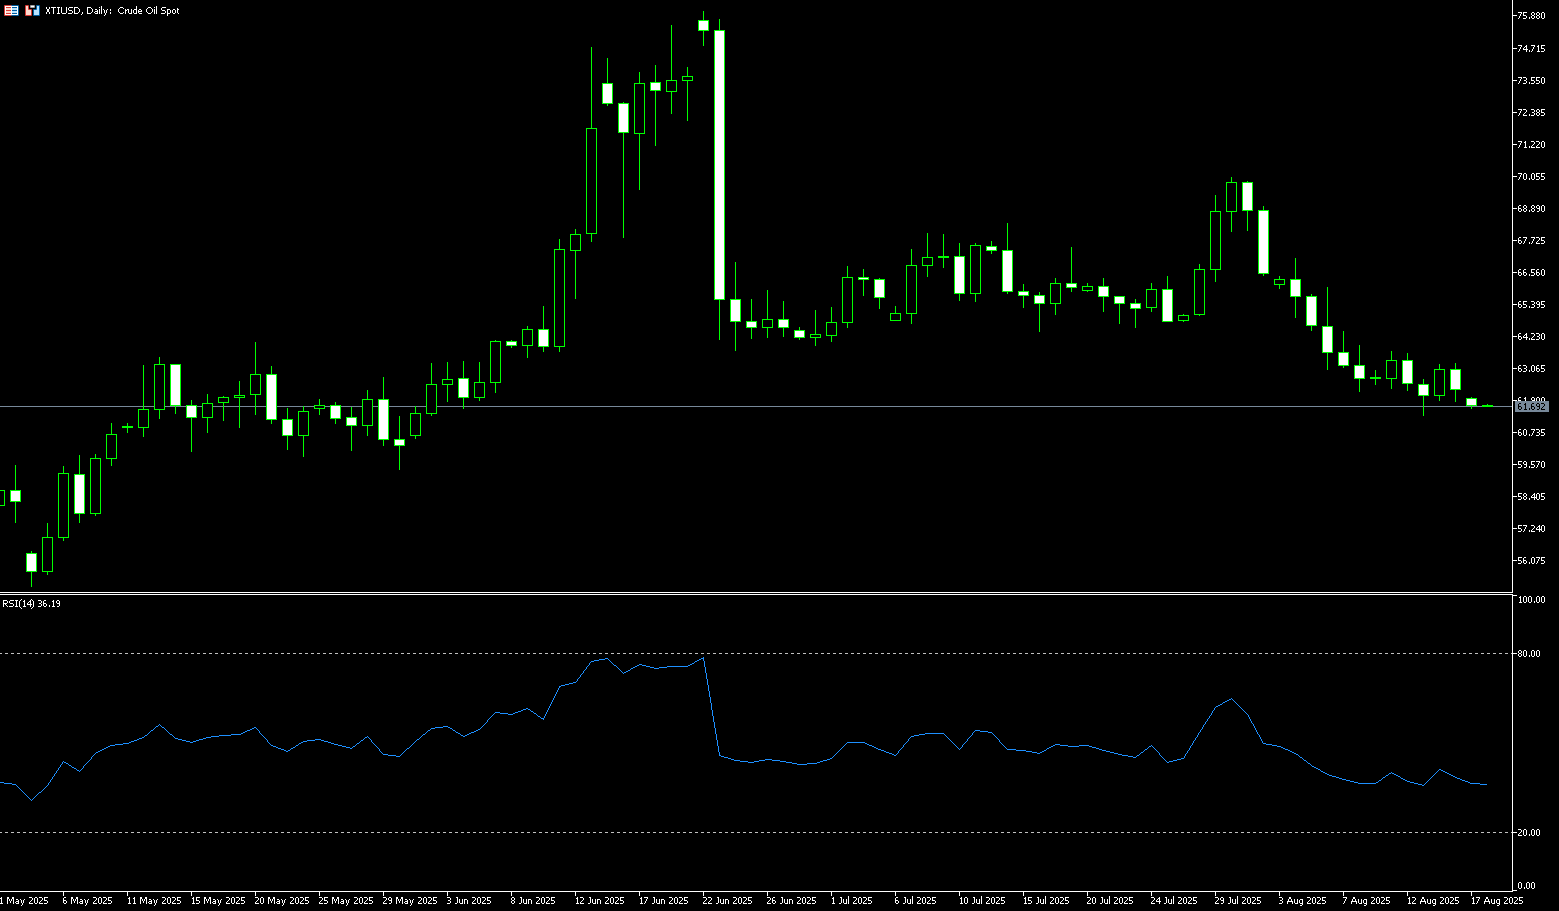
WTI crude oil prices fluctuated between the lows of $63.70 and $61.35 last week. WTI prices declined as traders focused on the in-person summit between US President Trump and Russian President Vladimir Putin in Alaska, which could significantly impact Russian supply. Trump and Putin will meet in Alaska to discuss the Ukraine issue. On Wednesday, Trump warned that Russia would face "very serious consequences" if Putin did not agree to end the war in Ukraine at Friday's meeting. Any signs of continued conflict between Russia and Ukraine could support WTI prices, while a positive outcome could weigh on crude oil prices. While a direct ceasefire is unlikely, a possible outcome of US-Russia cooperation and a framework for subsequent negotiations is bearish for oil prices. On the other hand, rising market bets on a Federal Reserve rate cut at its September meeting could weaken the US dollar and boost dollar-denominated commodities.
The US crude oil market has recently been weak. Crude oil prices are trading between a range bounded by the $63.09 (9-day simple moving average) upper (25-day moving average at $65.23) and last week's low at $61.35. Crude oil prices are currently finding some support, with the price choosing which range to enter. Technically, oil prices have been trending downward over the past few days. Currently, prices are approaching last week's low at $61.35, suggesting some support in the short term. The MACD indicator is in negative territory, and the gap between the DIFF and DEA is large, suggesting that oil prices may continue to face pressure in the short term. Meanwhile, the RSI is near 40.00, indicating that oil prices are approaching oversold territory, but not yet reaching extreme levels, suggesting some room for recovery. Chart-wise, oil prices have broken through previous support at $63.16 (the 61.8% Fibonacci retracement level of the $54.78 to $76.74 range) and are approaching the next support level of $61.35-61.00. If oil prices fall below this support range, they could fall further to $60.00 (a psychologically important market barrier). If oil prices stabilize above $63.090-63.09, they could challenge the 12-day moving average of $64.08. A break below this level could lead to $65.76 (the 50.0% Fibonacci retracement level).
Consider going long on crude oil at 62.13 today. Stop-loss: 62.00. Target: 63.60, 64.00.
Spot Gold
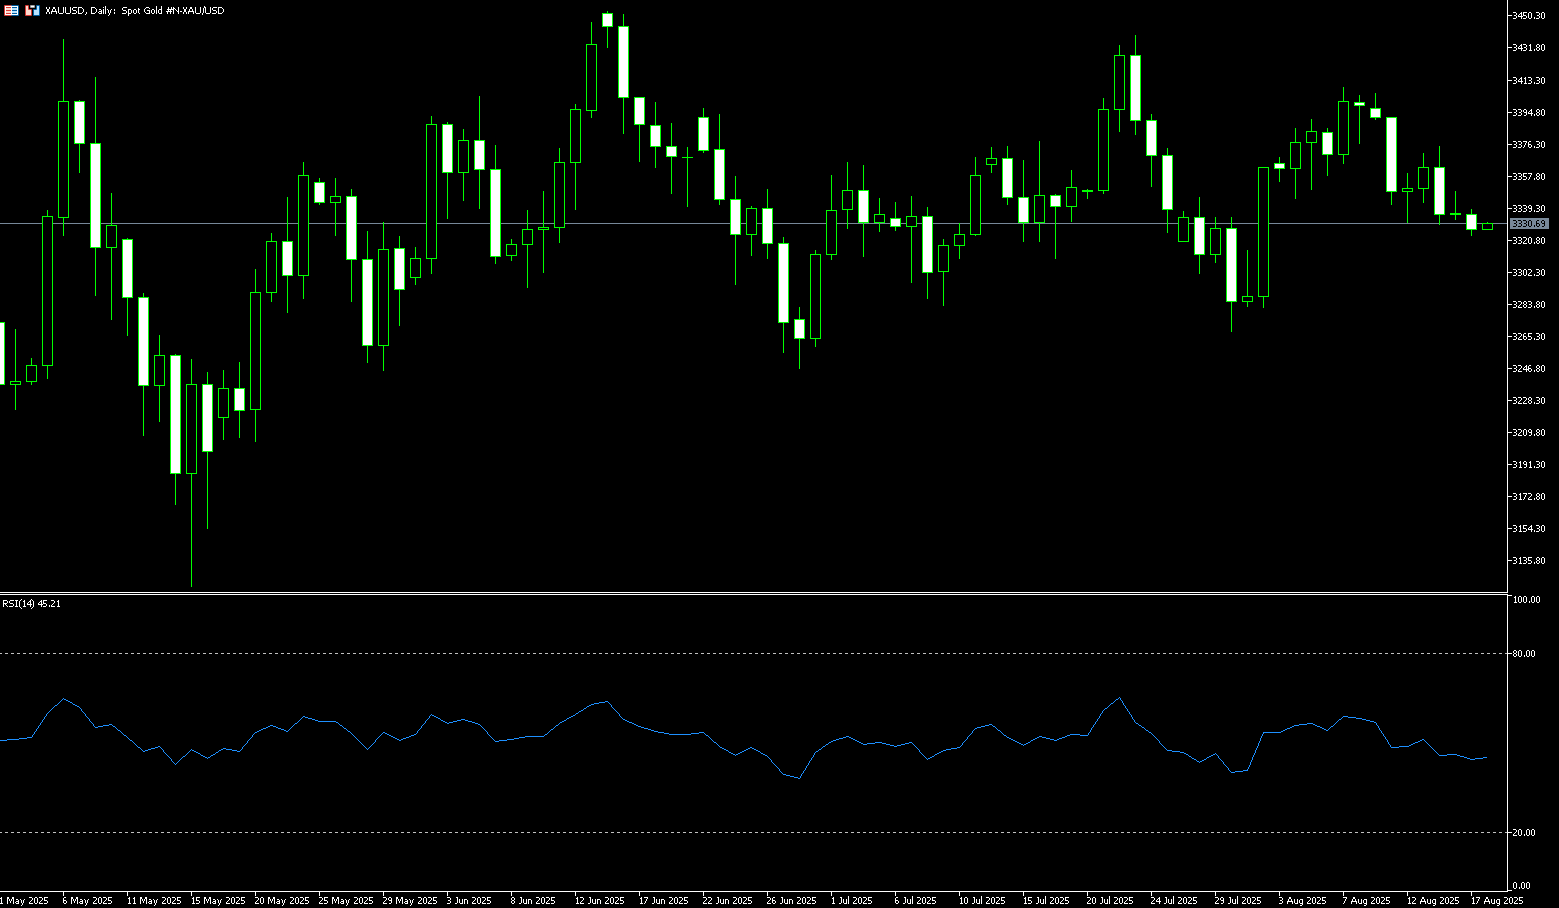
Gold prices fell to hover around $3,336 per ounce over the weekend, having earlier traded at $3,330. The weekly drop was approximately 1.80%, the largest since late June, as stronger-than-expected US data dampened market expectations for a significant Federal Reserve rate cut. US producer prices rose at their fastest pace in three years in July, far exceeding expectations, suggesting that businesses are passing on higher import costs from tariffs to consumers. Traders are now more inclined to believe a 25 basis point rate cut next month, followed by another in October, reflecting comments from Federal Reserve Chair Mary Daly opposing a 50 basis point cut in September. Investors' focus is shifting to whether Federal Reserve Chairman Jerome Powell will provide new guidance on monetary policy at the central bank's annual economic symposium in Jackson Hole, Wyoming, next week. On the geopolitical front, the market is cautiously anticipating a major breakthrough on the Ukraine war at the summit between Trump and Putin.
From a daily technical perspective, gold prices are consolidating after reaching the lower support line of an equilateral triangle pattern at $3,340. The 14-day relative strength index (RSI) is currently near the mid-48 level, highlighting investor hesitation at current levels. On the downside, a confirmed break below the August 12 low of $3,330 and the 89-day simple moving average at $3,331 would put the July 29 low and July 31 high, or $3,305-3,315, back in the spotlight for bears. Further downside, the next targets are the August 1 low of $3,282 and the lower Bollinger Band level at $3,281. On the other hand, any attempt to re-test the higher high remains limited by the 9-day simple moving average at $3,363. A bullish reaction above this level would shift the focus to $3,390 (the upper Bollinger Band line). A break below this level would target the $3,400 (round-number mark) - $3,410 (August 8 high), followed by the late July high of $3,339.
Consider a long position in gold at $3,332 today, with a stop-loss at $3,328 and targets at $3,355, $3,360.
AUD/USD
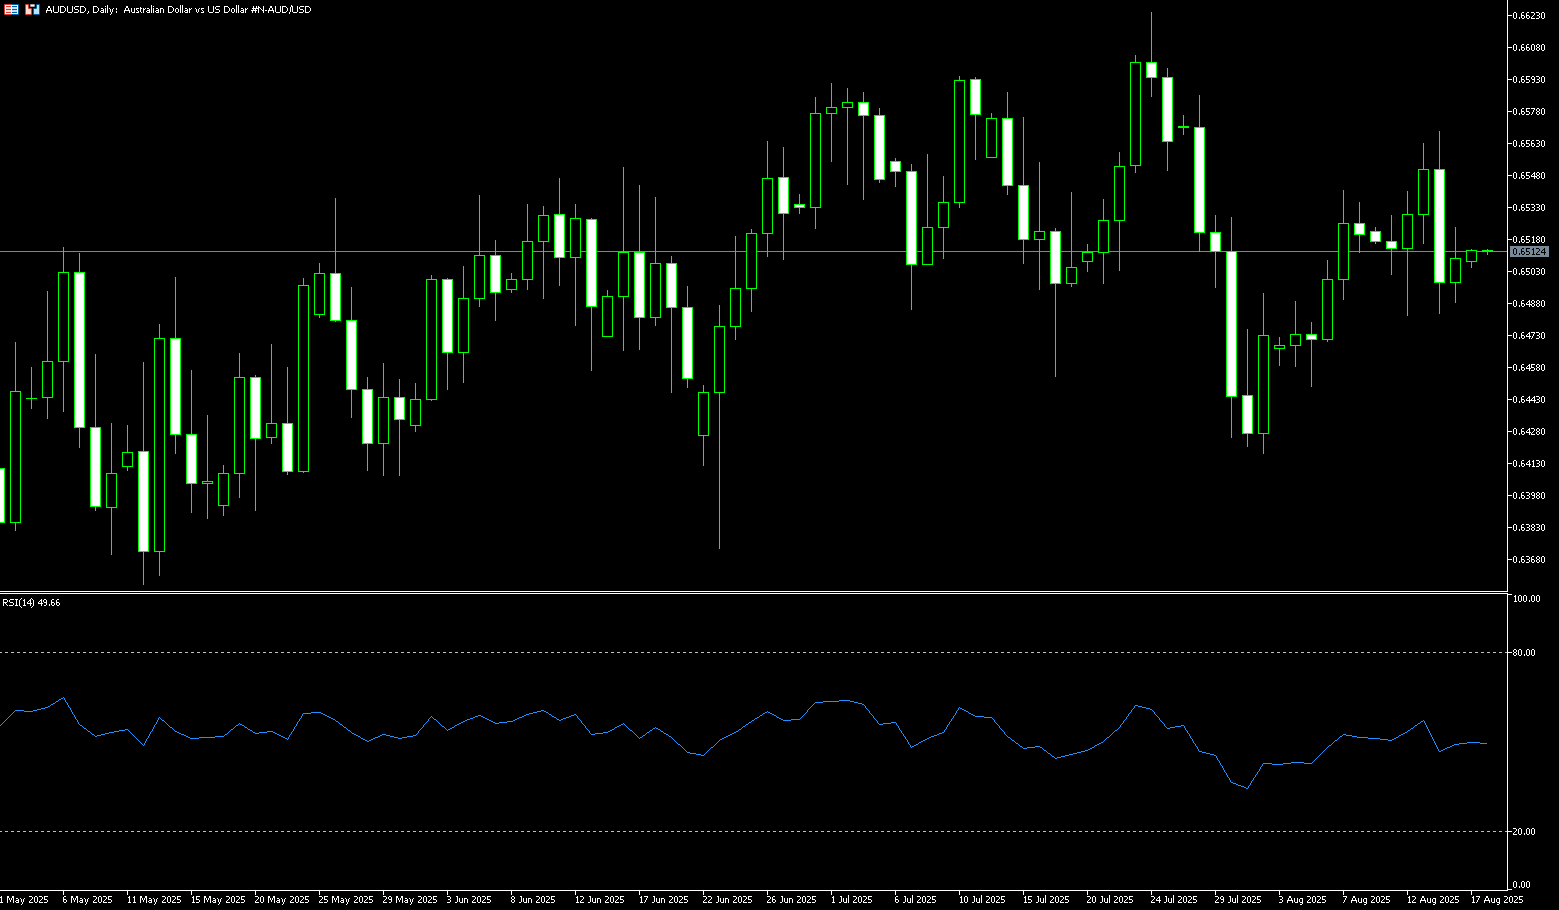
After stabilizing above its 89-day simple moving average at $0.6479 last week, the Australian dollar has re-traced its course above $0.6500. The dollar strengthened overnight following a stronger-than-expected US producer inflation report, dampening hopes for further rate cuts. US producer prices rose at their fastest pace in three years in July, contrasting with a more reassuring consumer inflation report earlier this week, suggesting rising inflationary pressures that could complicate the Federal Reserve's policy decisions. As a result, according to CME's FedWatch tool, the probability of a 25 basis point rate cut by the Federal Reserve has slightly decreased. Meanwhile, in Australia, investor sentiment remains cautious ahead of key data releases next week, including consumer inflation expectations, consumer confidence, and several purchasing managers' index surveys, particularly after recent employment data indicated continued labor market strength. Overall, the currency is on track to post losses this week.
AUD/USD was trading around 0.6500 before the end of last week. Technical analysis on the daily chart suggests a shift in momentum from bullish to consolidation, as the pair trades near the lower boundary of an equilateral triangle at 0.6495. The pair has also fallen below its 40-day simple moving average at 0.6525, suggesting a possible weakening of short-term momentum. Furthermore, the 14-day relative strength index (RSI) is below 50, indicating a bearish market bias. Therefore, on the downside, due to weakening short- and medium-term price momentum, if AUD/USD breaks below the lower line of the equilateral triangle at 0.6495, it could test the August 5 low of 0.6449, followed by the 0.6400 round-figure mark. On the upside, the pair could target immediate resistance at the 40-day simple moving average at 0.6526, followed by 0.6576 (the 76.4% Fibonacci retracement level from 0.6625 to 0.6420), and the 6600 level.
Consider a long AUD at 0.6496 today, with a stop-loss at 0.6485 and targets at 0.6540 and 0.6550.
GBP/USD
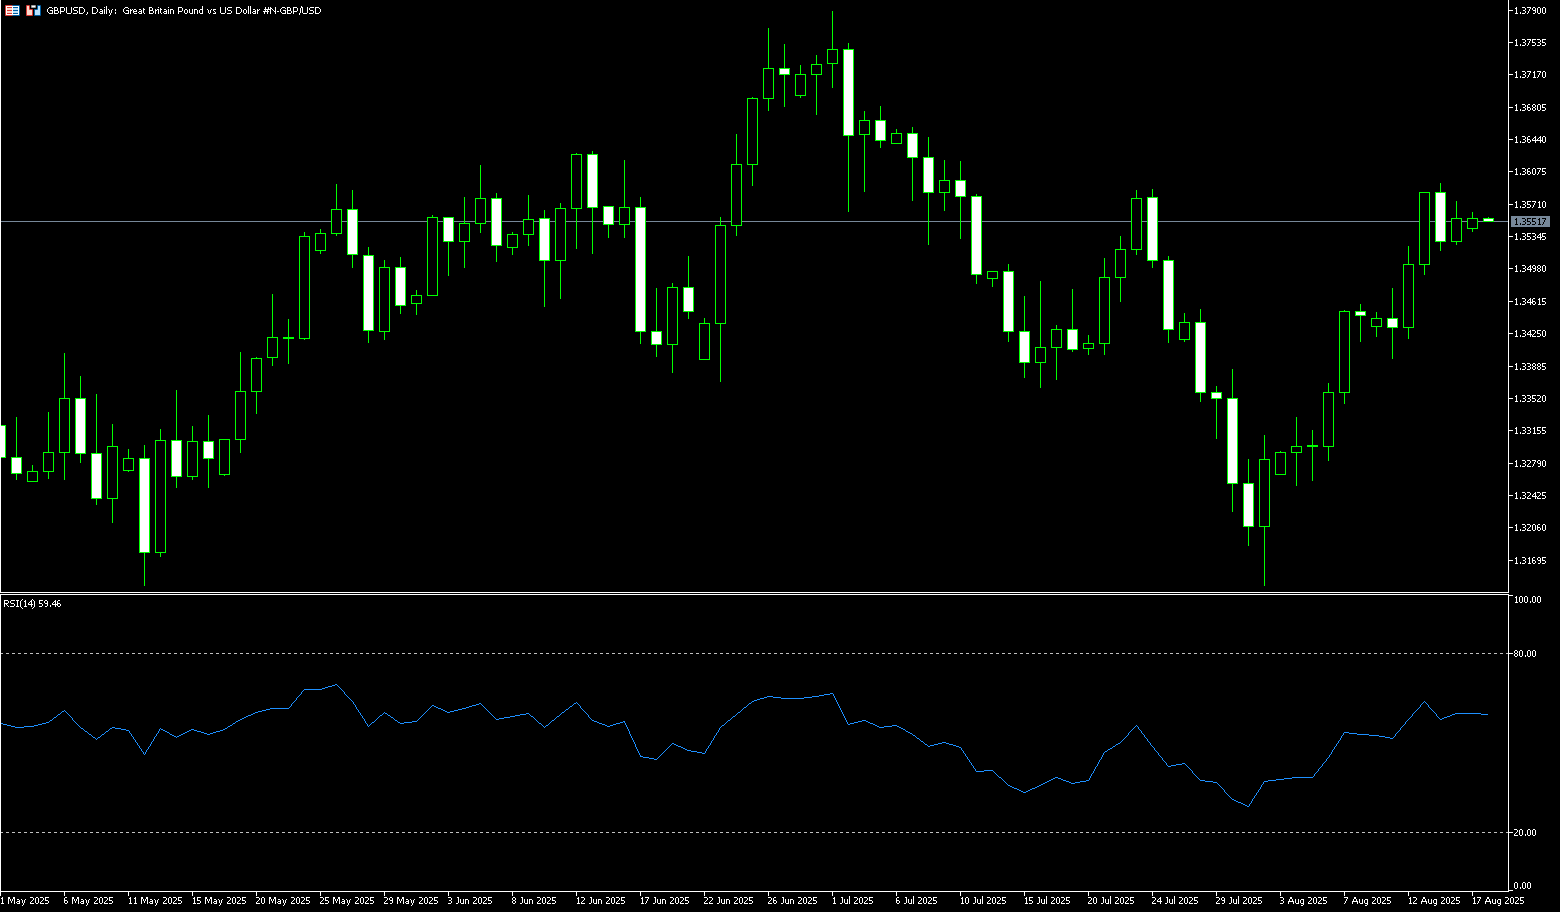
The British pound gained momentum against the US dollar in the latter half of last week as the US dollar came under pressure amid mixed US economic data, allowing GBP/USD to erase most of its mid-week losses. The pair is trading around 1.3560. The latest US data showed retail sales rose 0.5% in July, meeting expectations but missing projections for a 0.8% increase. On an annualized basis, retail sales rose 3.9%, down from a previous 4.4%. However, the report had limited impact on the US dollar, which remained under pressure. Furthermore, preliminary data from the University of Michigan showed weak consumer confidence. The consumer confidence index fell to 58.6 in August, significantly below expectations for 62.0. The weak headline data heightened concerns about the resilience of consumer demand. The US dollar index, which tracks the greenback against six major currencies, is currently trading around 97.80, near a two-week low, as markets digest the data with caution. A slight easing in expectations for a Fed rate cut may limit further downside for the dollar, although traders still place a high probability on a policy adjustment next month.
The daily chart shows that the 9-day (1.3461) and 89-day (1.3445) lines formed a bullish "golden cross" pattern last week. Momentum indicators appear mixed: the Relative Strength Index (RSI) is near 60, suggesting further upside potential in the short term, although the Average Directional Index (ADX) is below 20, suggesting a lack of momentum in the current trend. GBP/USD currently faces strong upward resistance at 1.3590 (the ascending triangle resistance line); 1.3595 (the August 14 high); and 1.3600 (a psychologically important level). A break above these levels would pave the way for GBP/USD to challenge the July 4 weekly high of 1.3681, followed by the 2025 ceiling of 1.3788 (July 1). On the other hand, the 89-day simple moving average provides interim support at 1.3445, followed by 1.3400 (the round-number mark), and the August 1 low of 1.3399 (August 11). A break below these support levels would place the 110-day simple moving average at 1.3350 (the 110-day simple moving average).
Consider a long GBP at 1.3546 today, with a stop-loss of 1.3532 and targets of 1.3610 and 1.3620.
USD/JPY
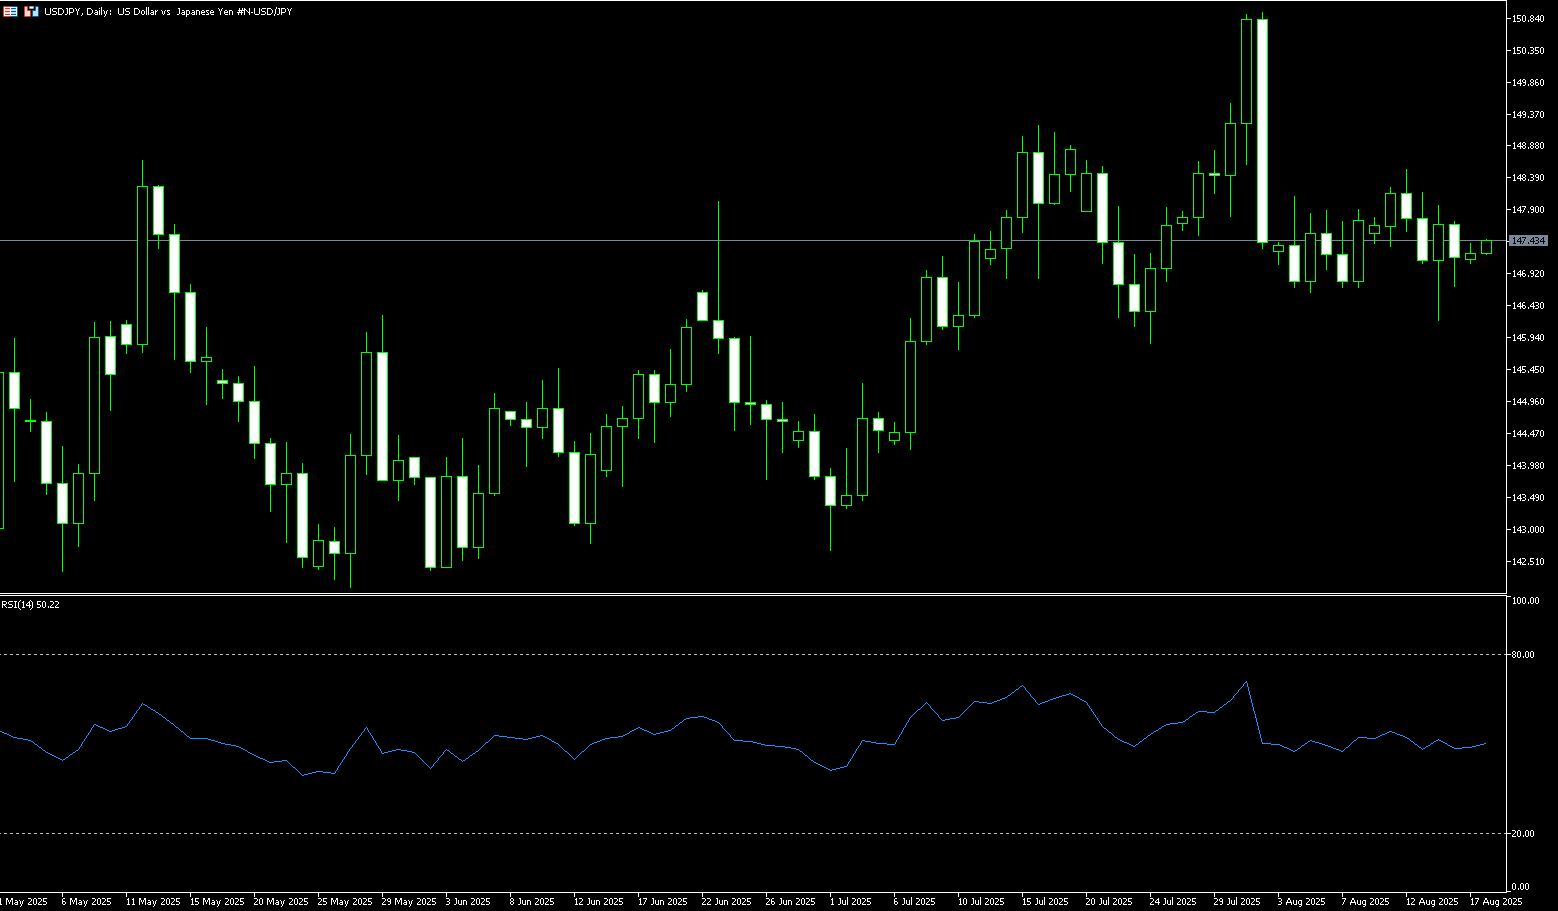
USD/JPY briefly dipped below 147 before the weekend, erasing losses from the previous session on stronger-than-expected GDP data and expectations of a Bank of Japan rate hike. Japan's economy grew by 0.3% in the second quarter, accelerating from 0.1% in the first quarter, in line with the consensus forecast. The rise was primarily driven by net exports, which contributed 0.3 percentage points to growth despite the risk of US tariffs. The yen also received support from comments by US Treasury Secretary Scott Besant, who suggested the Bank of Japan was lagging in its fight against inflation. Furthermore, the central bank is under pressure to abandon its inflation target tied to domestic demand and wage growth, which has limited policy tightening. Meanwhile, the Bank of Japan's relatively hawkish outlook diverged significantly from that of other major central banks, including the Federal Reserve, which is expected to resume its rate-cutting cycle in September. This, in turn, failed to help the dollar capitalize on Thursday's rebound from strong US Producer Price Index (PPI) data, further driving flows to the lower-yielding yen, which appears largely unfazed by the current risk-on environment.
From a technical perspective, USD/JPY fell from 148.52 at the beginning of last week to a nearly three-week low of 146.22. Currently oscillating near the 147.00 mark, this level, combined with the 146.80 (50.0% Fibonacci retracement level from 142.68 to 150.92), represents a key turning point. A sustained strong breakout could potentially lift the spot price to the 147.96 (14-day simple moving average) - 148.00 (round number mark) area. Some follow-up buying could shift the short-term bias towards the 148.98 (23.6% Fibonacci retracement level), paving the way for bullish traders to further advance and recapture the 149.00 round number mark. On the other hand, if USD/JPY breaks below the support line of the daily "descending triangle" at 146.70, the pair could retest the multi-week low reached last Thursday, around 146.22. Some follow-through selling, leading to a subsequent break below the 146.00 round-figure mark, would be seen as a new trigger for bearish traders, leaving spot prices vulnerable. The downside trajectory could extend to the next relevant support level, near the 145.40-145.30 area, towards the psychological 145.00 mark.
Consider shorting the USD at 147.45 today. Stop-loss: 147.70, target: 146.50 146.30
EUR/USD
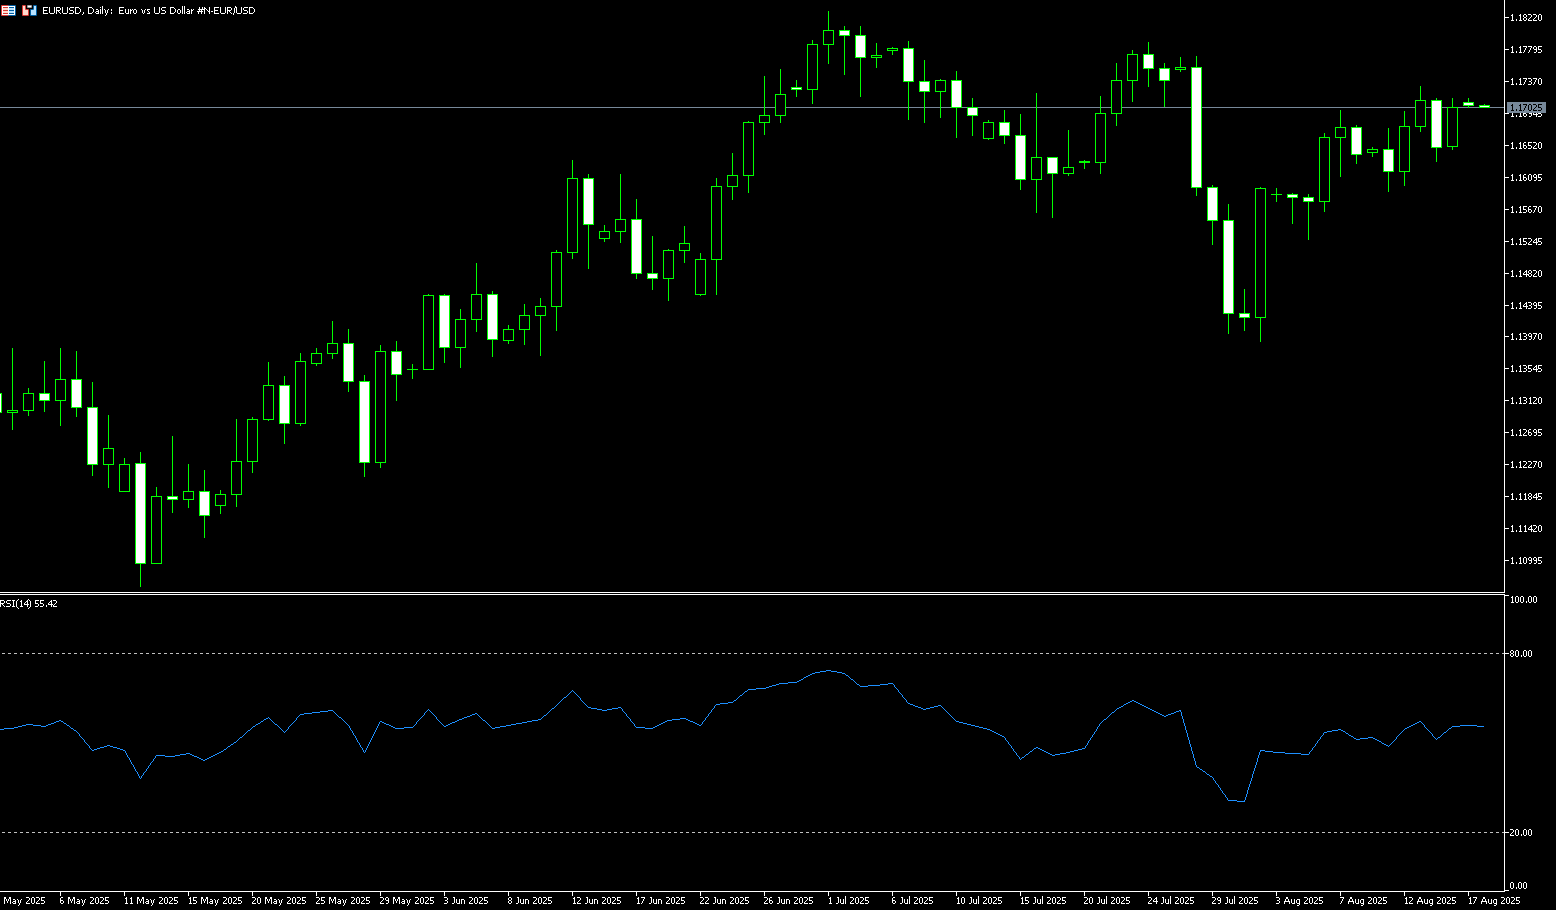
The euro hovered just above $1.1700 last week, just below the 2021 high of $1.1830 reached last month, as traders weighed the economic, political, and monetary outlooks. Attention shifted to the meeting between US President Trump and Russian President Vladimir Putin aimed at finding a solution to the conflict in Ukraine. Ukrainian President Volodymyr Zelensky was reportedly unlikely to attend. In the US, market expectations for an upcoming Federal Reserve rate cut grew amid weak employment data and a decline in the ISM services purchasing managers' index. Meanwhile, the European Central Bank ended its current easing cycle in July after eight rate cuts over the past year, bringing borrowing costs to their lowest level since November 2022. However, some market participants believe the ECB may cut rates again before the end of the year. On the economic front, eurozone GDP grew by 0.1% in the second quarter, while inflation remained at 2% in July. However, risks remain as the European Union faces a 15% tariff on most European goods exported to the US.
The daily chart shows that the EUR/USD's 14-day Relative Strength Index (RSI) is slightly above 50, but the Average Directional Index (ADX) is close to 14, still pointing to a lack of confidence. Currently, the pair is consolidating around its 5-day simple moving average of 1.1668, reflecting temporary indecision. Above, resistance at 1.1770 (the July 28 high) could pose a significant challenge for bulls. Further upside, the July 24 high of 1.1790 and the psychologically important 1.1800 level will come into focus. This is followed by the 2025 ceiling of 1.1830 (the July 1 high). On the other hand, initial support at 1.1611 (the 55-day simple moving average) and the 1.1600 level (the round-figure mark) will support the current bullish trend. Further downside, the next targets are the 1.1563 (65-day simple moving average) and the 1.1500 (round number mark) strengthening zone.
Today, consider going long on the euro at 1.1695, with a stop loss at 1.1680 and targets at 1.1750 and 1.1760.
Disclaimer: The information contained herein (1) is proprietary to BCR and/or its content providers; (2) may not be copied or distributed; (3) is not warranted to be accurate, complete or timely; and, (4) does not constitute advice or a recommendation by BCR or its content providers in respect of the investment in financial instruments. Neither BCR or its content providers are responsible for any damages or losses arising from any use of this information. Past performance is no guarantee of future results.
More Coverage


Risk Disclosure:Derivatives are traded over-the-counter on margin, which means they carry a high level of risk and there is a possibility you could lose all of your investment. These products are not suitable for all investors. Please ensure you fully understand the risks and carefully consider your financial situation and trading experience before trading. Seek independent financial advice if necessary before opening an account with BCR.

 English
 简体中文
简体中文
 繁體中文
繁體中文
 Bahasa
Melayu
Bahasa
Melayu
 Tiếng
Việt
Tiếng
Việt
 ไทย
ไทย
 日本語
日本語
 한국어
한국어
 ភាសាខ្មែរ
 español