


0
US Dollar Index
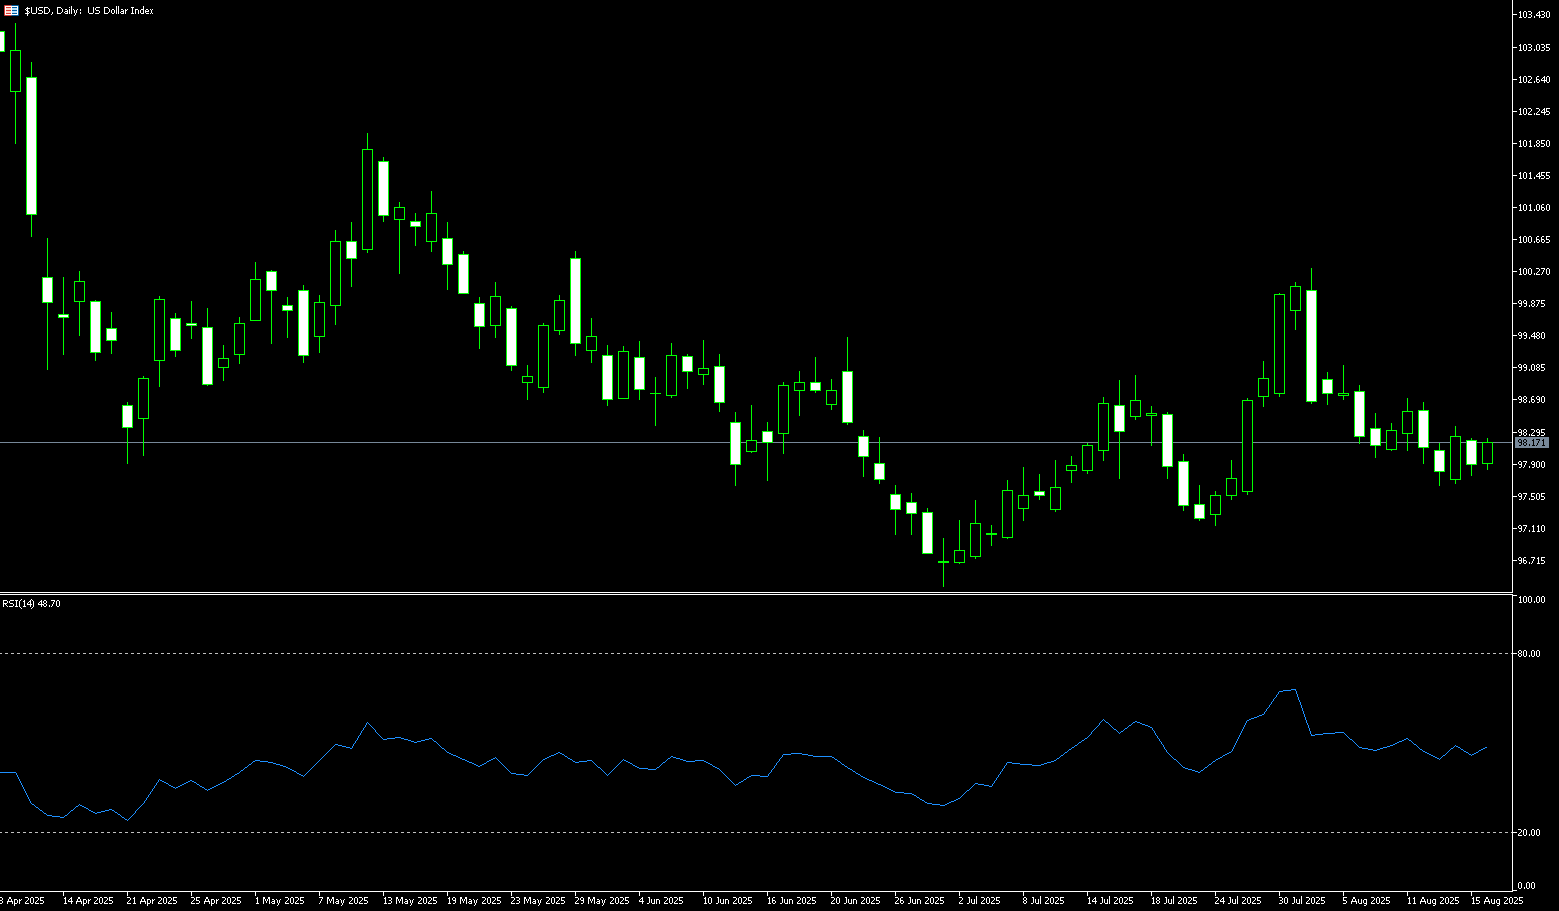
The US dollar index hovered around 98.00 on Monday as investors awaited a crucial meeting between US President Trump and Ukrainian President Volodymyr Zelensky in Washington, D.C., while also looking ahead to the Federal Reserve's Jackson Hole symposium later this week. Trump said he would urge Zelensky to reach a swift reconciliation following talks with Russian President Vladimir Putin. Although the meeting failed to produce a ceasefire breakthrough, Putin agreed to allow the United States and Europe to provide strong security guarantees to Ukraine in a potential agreement to end the war. On the monetary policy front, the market is pricing in an 84% probability of a 25 basis point rate cut by the Federal Reserve in September, although stronger-than-expected producer inflation and retail sales have reduced the likelihood of a 50 basis point cut. Fed Chairman Jerome Powell is expected to provide further guidance at Jackson Hole.
On the daily chart, the US dollar index is trading below its 20-day simple moving average (98.32) and last week's high of 98.67, suggesting an overall bearish bias. Momentum indicators are also weakening: the 14-day relative strength index (RSI) has fallen to near 46, indicating fading bullish momentum, while the average directional index (ADX) remains near 13, suggesting a lack of a strong directional trend. If the US dollar index breaks below its "double bottom" at 97.63, the next support level is 97.00 (round number), followed by its multi-year low of 96.37 (July 1). On the other hand, the first hurdle is the 20-day simple moving average at 98.32; a decisive break above this level could clear the way to the 75-day simple moving average at 98.67 and the round number at 99.00.
Consider shorting the US Dollar Index at 98.25 today, with a stop-loss at 98.36 and a target of 97.90 or 97.80.
WTI Spot Crude Oil
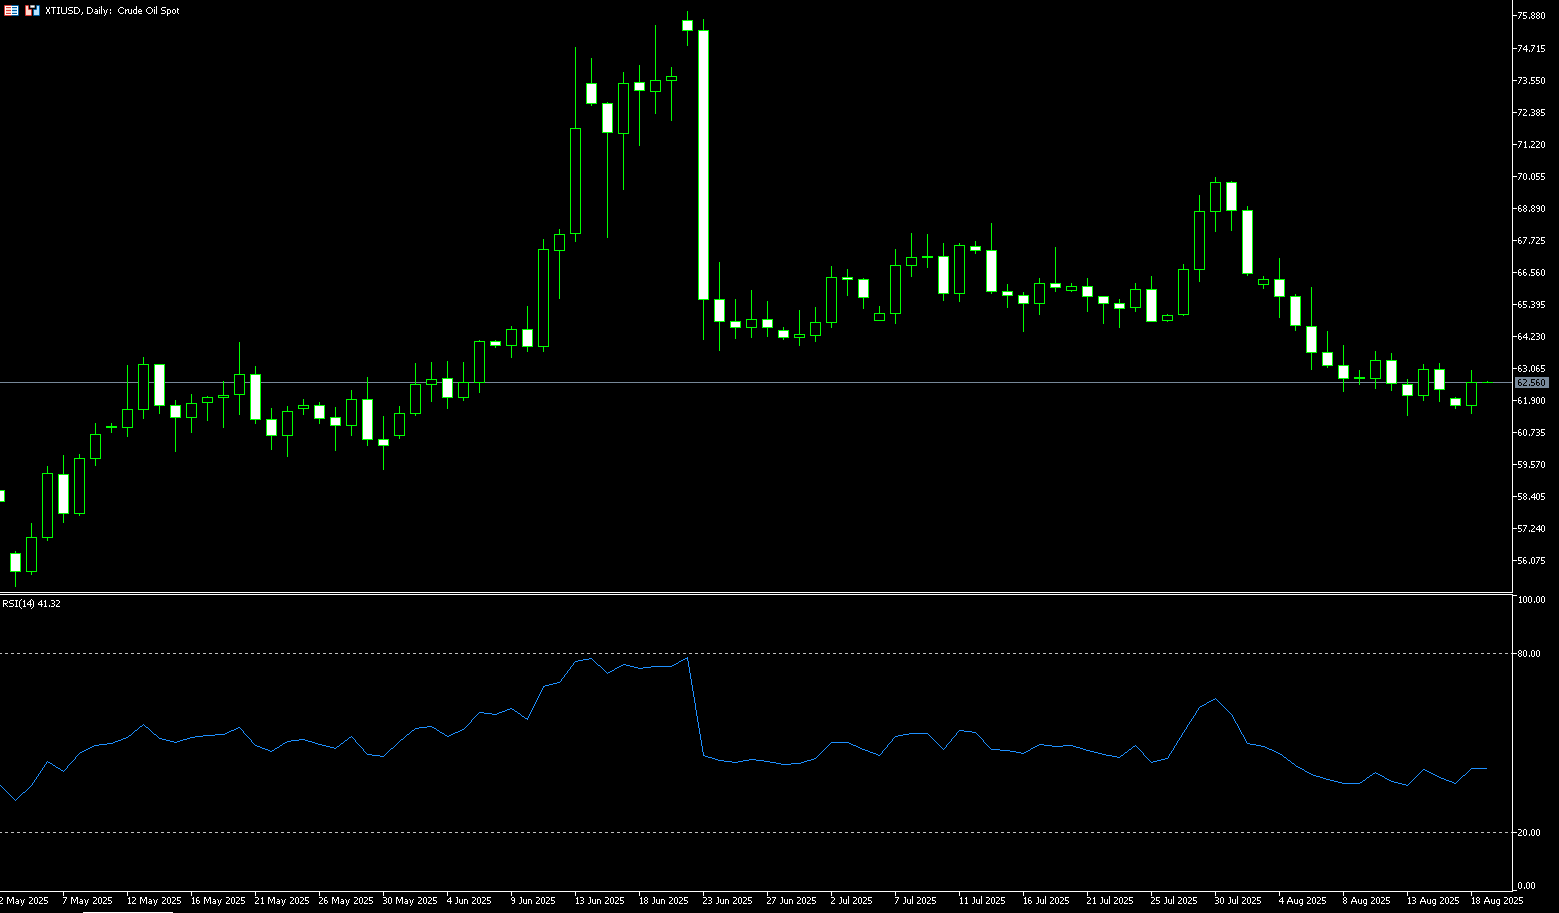
WTI crude oil hovered around $62.50 per barrel on Monday, recouping losses from the previous session, as the market focused on a meeting between US President Trump and Ukrainian President Volodymyr Zelensky in Washington, D.C., aimed at promoting a peace deal with Russia. The talks will also include European Commission President Ursula von der Leyen, French President Emmanuel Macron, and NATO Secretary-General Mark Rutte. Trump said he would urge Zelensky to agree to a quick resolution following Friday's discussions with Russian President Vladimir Putin, which focused on Moscow's demands for Ukrainian territorial cessions. He also expressed little urgency for penalties against Russia and countries that purchase Russian oil, softening his earlier stance during the Alaska summit. Oil prices have fallen over 10% this month, pressured by concerns about the economic impact of Trump's tariffs and increased OPEC+ supply.
The daily chart shows that US crude oil prices have found initial support near $61.35 (the August 13 low) and $61.00 (a round-number mark). However, significant resistance remains above $64.86 (the 20-day moving average) and $65 (a round-number mark). If oil prices continue to trade below $63.16 (the 61.8% Fibonacci retracement level of $54.78 to $76.74), and approach the next support level of $61.35-61.00, the short-term trend may remain volatile and weak. The MACD momentum histogram remains in a contracting phase, indicating weakening bearish momentum, but bulls have yet to achieve a significant breakthrough. If subsequent news is unfavorable for tightening supply, oil prices may fluctuate and consolidate in the $60-65 range. The direction of the breakthrough will still depend on geopolitical developments and Federal Reserve policy signals.
Consider going long on crude oil at 62.43 today. Stop-loss: 62.25. Target: 63.80, 64.00.
Spot Gold
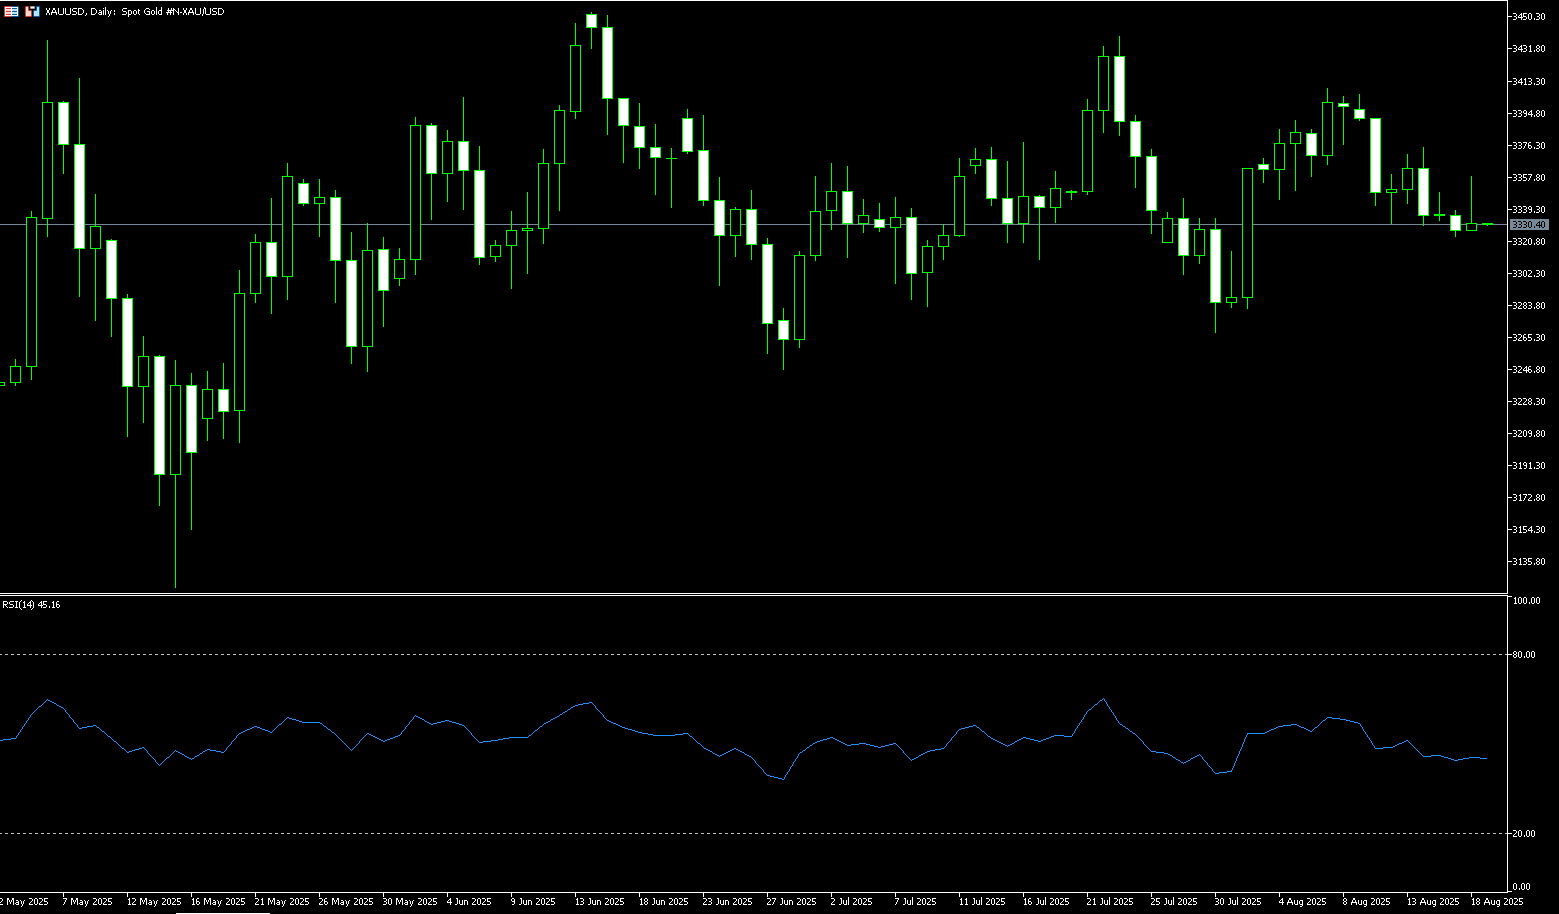
Gold prices held steady near $3,330/oz on Monday. Higher-than-expected inflation data prompted the market to pare back rate cut bets, while easing tensions between the US and Russia limited gold's gains. Gold prices attracted some selling in early Asian trading on Monday, trading near $3,340. The precious metal dipped slightly following the release of unexpectedly strong US Producer Price Index data. Stronger-than-expected inflation data released last week prompted traders to pare back bets on a September Federal Reserve rate cut, creating a headwind for gold. However, cautious market sentiment could drive safe-haven inflows and help limit gold's losses. Investors will closely monitor the meeting between US President Donald Trump and Ukrainian President Volodymyr Zelensky later on Monday for further developments.
Gold's short-term technical outlook points to a neutral stance. The Relative Strength Index (RSI) on the daily chart is trading sideways near 50, with gold trading below its 20-day (3,353) and 50-day (3,349) simple moving averages. If gold fails to recapture these moving averages, technical sellers may remain interested. In this scenario, the August 12 low of $3,330 and the 89-day SMA at $3,330 would put the July 29 low and July 31 high, or $3,305-3,315, back in the spotlight for bears. Further downside, the next targets would be the August 1 low of $3,282 and the lower Bollinger Band of $3,281. If gold stabilizes above $3,349-3,353 and turns this area into support, the next resistance level could be the 9-day SMA at $3,358. A bullish reaction above this level would shift the focus to $3,390 (the upper Bollinger Band line), with a breakout targeting $3,400 (the round number mark).
Consider going long on gold at $3,328 today, with a stop-loss at $3,325 and targets at $3,350 and $3,355.
AUD/USD
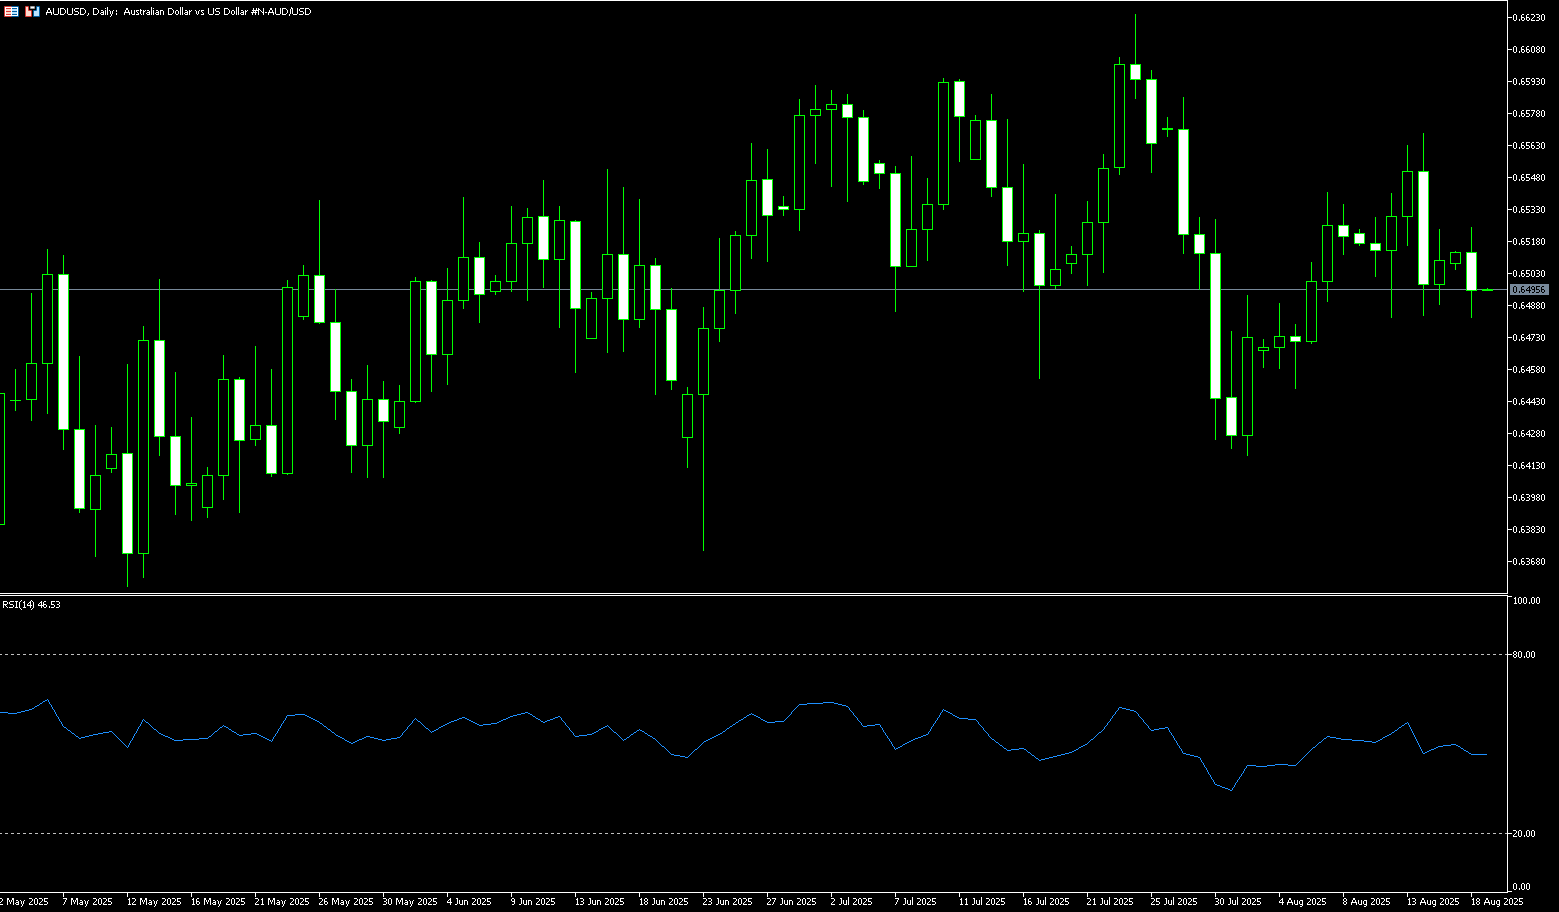
AUD/USD fluctuated below $0.6500 on Monday. USD/AUD remained weak as US economic data supported expectations of a September rate cut by the Federal Reserve. Investors will be watching the preliminary S&P Global Purchasing Managers' Index (PMI) data due later Thursday. According to preliminary data from the University of Michigan, US consumer confidence lost momentum in August, falling to 58.6 from 61.7 in July. This reading, below expectations of 62.0, suggests weakening public confidence and is exerting some selling pressure on the US dollar. Meanwhile, money markets are currently pricing in a near 93% probability of a 25 basis point rate cut in September. Meanwhile, weak Chinese economic data released on Friday could weigh on the Australian dollar. The National Bureau of Statistics (NBS) reported on Friday that China's retail sales grew 3.7% year-on-year in July, below expectations of 4.6% and 4.8% in June. Weak Chinese data tends to negatively impact the Australian dollar.
Looking at the technical trend this month, after recovering some gains from a five-week low of 0.6420 in early August, the AUD/USD pair has subsequently rebounded, peaking at 0.6600 (a psychological level) before retreating. However, the downward trend is currently facing key support at the round number of 0.6500 and the 75-day simple moving average of 0.6496. The 14-day relative strength index (RSI) on the daily chart is near 50, suggesting a lack of short-term direction. On the downside, the next support level is 0.6500-0.6496. A break below this would open the way to the low of 0.6449 set on August 5. The next key support level is 0.6400. On the upside, the next resistance level is last week's high of 0.6568, followed by the psychologically important 0.6600 level.
Consider a long position on the Australian dollar at 0.6480 today, with a stop-loss at 0.6470 and targets at 0.6540 and 0.6550.
GBP/USD
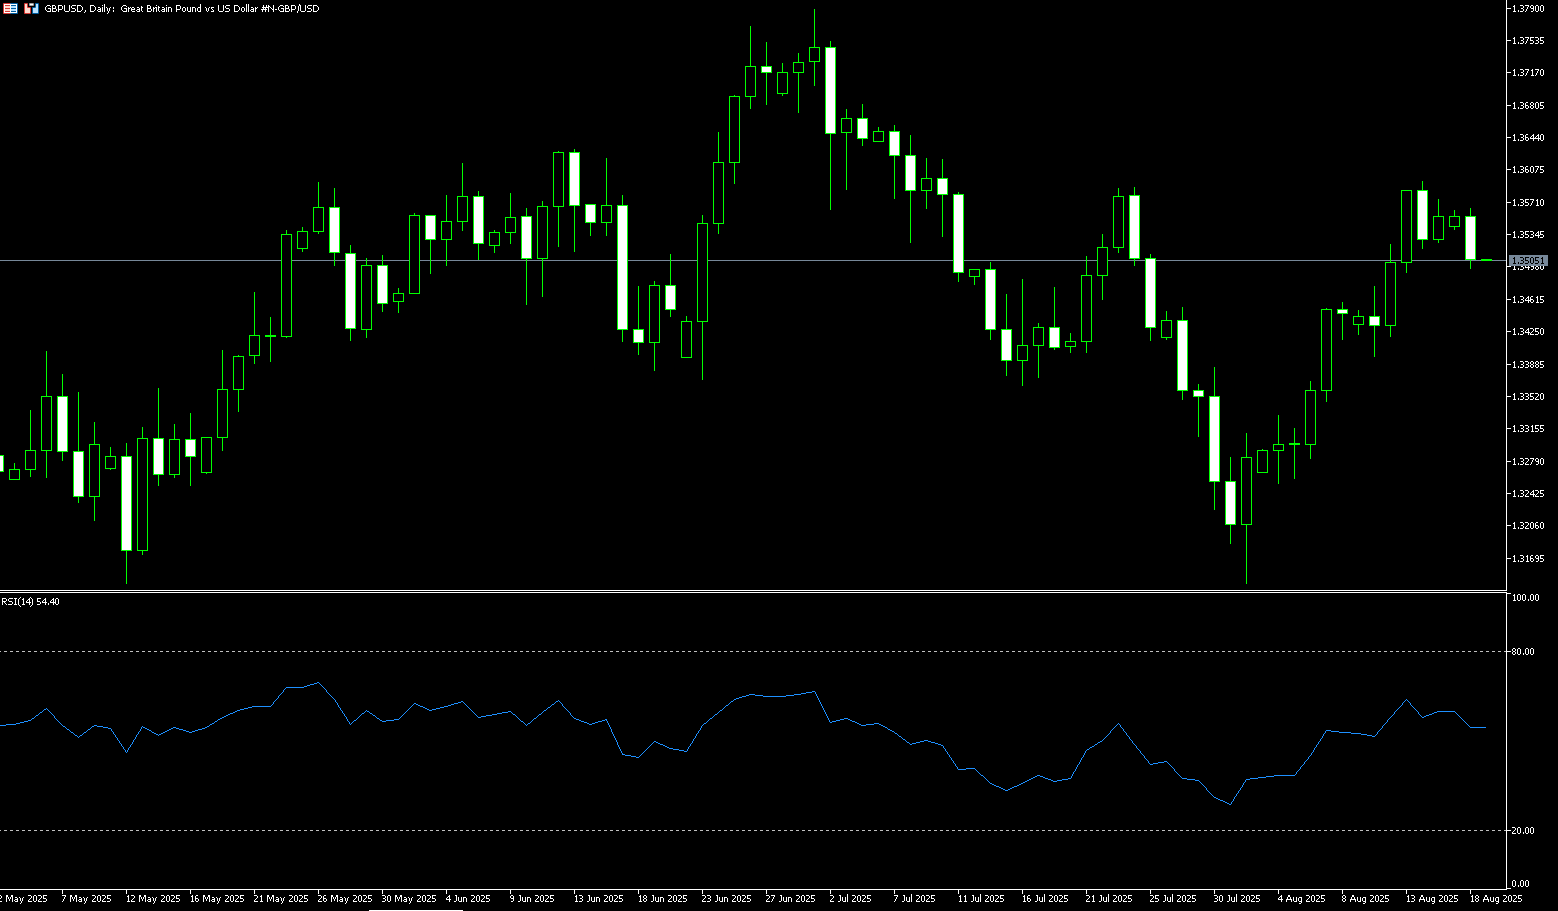
GBP/USD retreated to around 1.3510 on Monday, pressured by a stronger US dollar. The market turned cautious ahead of the meeting between US President Trump and Ukrainian President Volodymyr Zelensky. Ahead of the Trump-Zelensky meeting, the US dollar strengthened, and caution prevailed. Traders are looking forward to Monday's Trump-Zelensky meeting in Washington, D.C., as it could provide clues regarding a ceasefire agreement or new sanctions against Russia and its crude oil buyers. Any signs of continued geopolitical tensions could boost safe-haven demand and create short-term resistance for major currency pairs. Market attention will turn to Tuesday's UK CPI inflation data for fresh momentum. Core CPI is expected to rise 3.7% year-on-year in July. If the data comes in above expectations, it could reduce market expectations for a Bank of England rate cut in September, potentially boosting the GBP/USD exchange rate.
After rebounding to its August high of 1.3594 (August 14) last week, GBP/USD faces the next upward resistance at 1.3600, a psychologically important level. Momentum indicators on the daily chart appear mixed: the 14-day relative strength index (RSI) is near 60, suggesting further upside potential in the short term, although the average directional index (ADX) is below 20, suggesting a lack of momentum in the current trend. A breakout above the 1.3594-1.3600 area would pave the way for GBP to challenge 1.3662 (July 7 high), followed by the 2025 ceiling of 1.3700 (round number). On the other hand, the 1.3500 round number acts as interim support, followed by 1.3449 (89-day simple moving average).
Consider a long GBP at 1.3490 today, with a stop loss of 1.3480 and a target of 1.3550 or 1.3560.
USD/JPY
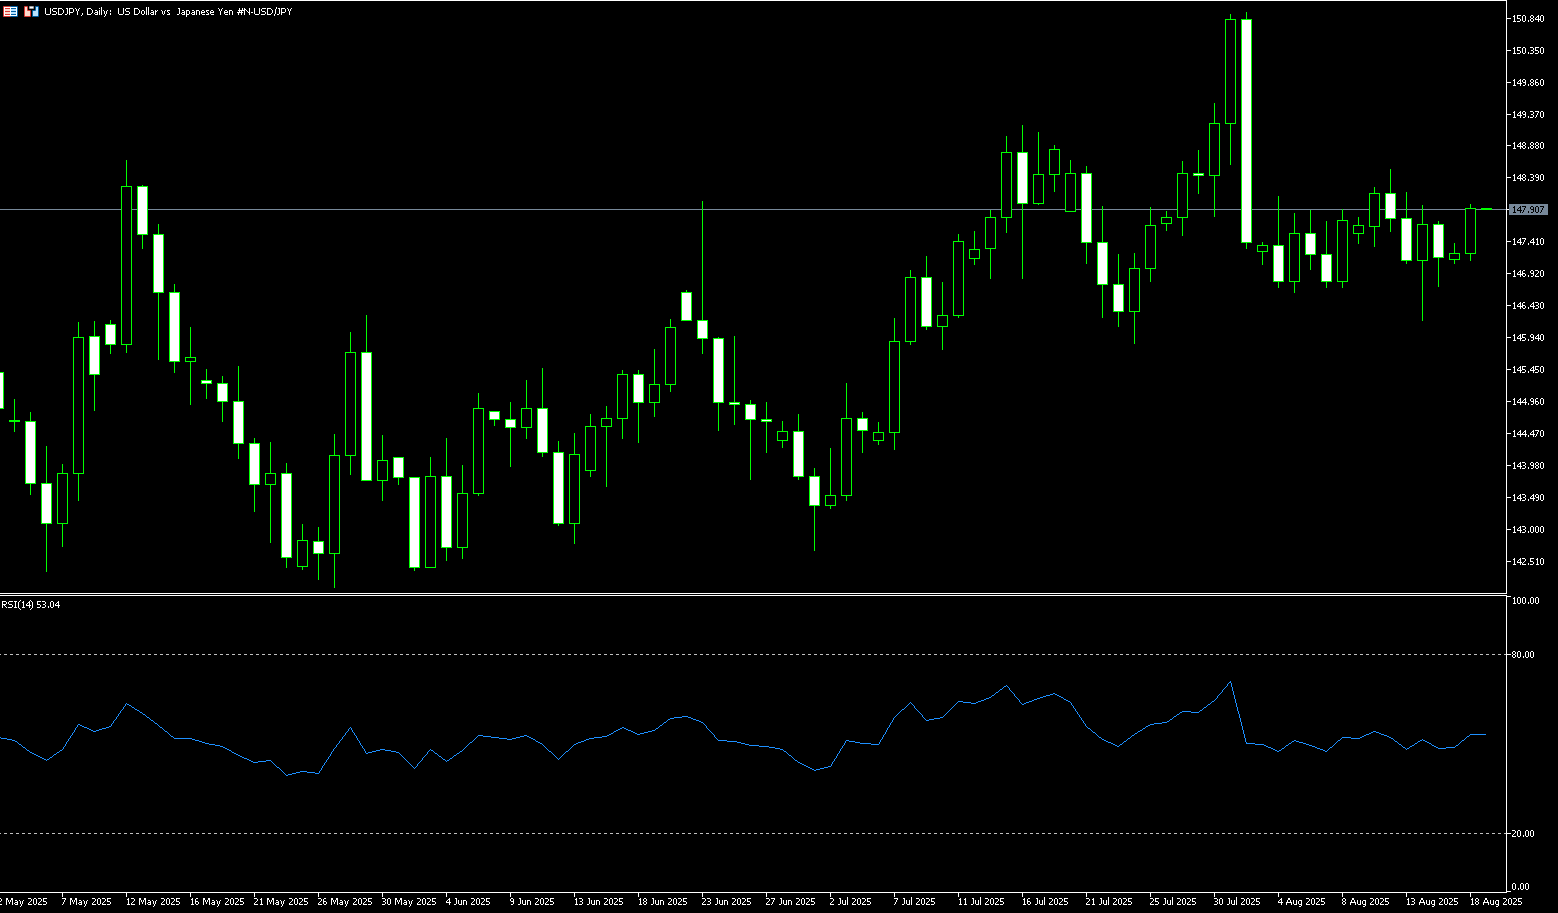
The yen weakened against the dollar to around 147.70 on Monday as the dollar rallied ahead of a crucial meeting between US President Donald Trump and Ukrainian President Volodymyr Zelensky. Investors also watched the Federal Reserve's annual Jackson Hole symposium this week for signals on the global interest rate outlook. In Japan, data released last Friday showed that second-quarter economic growth exceeded expectations, supported primarily by net exports, despite headwinds from US tariffs. Meanwhile, Japanese officials downplayed comments by US Treasury Secretary Scott Bessant, who suggested the Bank of Japan was "lagging" on policy, as an attempt to pressure the central bank to raise interest rates. Bank of Japan Governor Kazuo Ueda also struck a cautious tone, emphasizing that "underlying inflation" remains below the 2% target.
On the 4-hour chart, USD/JPY's breakout and acceptance of its 200-hour simple moving average, around 147.40, could be seen as a fresh trigger for bearish USD/JPY traders. Meanwhile, any meaningful rebound attempt is more likely to attract fresh selling and be capped near the 148.00 support-turned-resistance level. The latter should now serve as a key pivot point for day traders, a breakout of which could trigger a fresh wave of covering activity, pushing the pair towards the 148.52 (August 12 afternoon high) area. Nevertheless, USD/JPY appears poised to slide below 146.00 (July 24 low) before declining further to the next relevant support level of 145.40-145.30. The downward trajectory could eventually extend to challenge the psychological level of 145.00.
Consider shorting the US dollar at 148.05 today. Stop-loss: 148.30, target: 147.10
EUR/USD
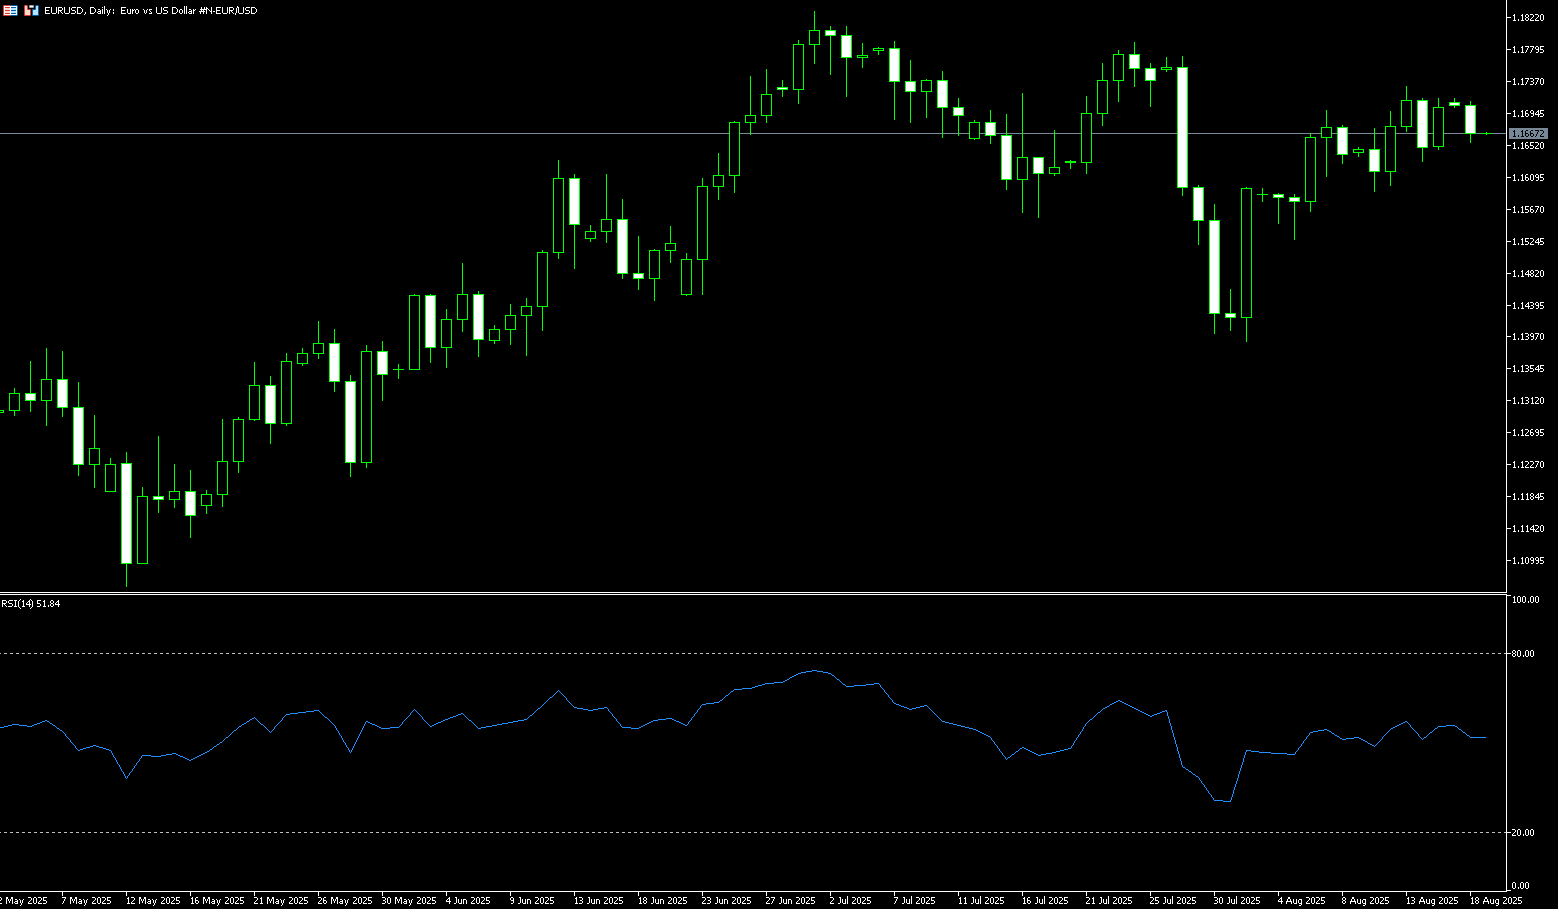
EUR/USD traded slightly below 1.1700 on Monday. However, the US dollar may come under pressure due to the dovish tone surrounding the Federal Reserve's September policy outlook, potentially resuming its upward trend. Traders will likely focus on Thursday's preliminary S&P Global Purchasing Managers' Index (PMI) data, which will maintain the case for a September rate cut by the Federal Reserve. The Michigan Consumer Confidence Index fell to 58.6 in August, down from 61.7 in July and below expectations of 62.0. Meanwhile, US retail sales rose 0.5% month-over-month in July, compared to a 0.9% increase in June. This data was in line with market consensus. Traders will likely monitor upcoming inflation data from the Eurozone and Germany, which could influence the likelihood of a pause in the ECB's easing cycle.
The daily chart shows that after the EUR/USD uptrend resumed last week, bulls have repeatedly failed to challenge the 1.1700 round number. Therefore, buying must achieve a daily close above 1.1700 to pave the way for further gains. Meanwhile, momentum, as measured by the 14-day Relative Strength Index (RSI), suggests the potential for further gains (currently at 56). If buyers can keep the pair oscillating above 1.1700, the next upside target is the July 24 high of 1.1788, which could challenge the 1.1800 round number and the year-to-date high of 1.1830. On the other hand, a daily close below 1.1700 could test the confluence of the 50-day simple moving average near 1.1637. Further losses could occur below the 1.1600 level.
Today, you can consider buying EUR at 1.1650, stop loss: 1.1640, target: 1.1700; 1.1710
Disclaimer: The information contained herein (1) is proprietary to BCR and/or its content providers; (2) may not be copied or distributed; (3) is not warranted to be accurate, complete or timely; and, (4) does not constitute advice or a recommendation by BCR or its content providers in respect of the investment in financial instruments. Neither BCR or its content providers are responsible for any damages or losses arising from any use of this information. Past performance is no guarantee of future results.
More Coverage


Risk Disclosure:Derivatives are traded over-the-counter on margin, which means they carry a high level of risk and there is a possibility you could lose all of your investment. These products are not suitable for all investors. Please ensure you fully understand the risks and carefully consider your financial situation and trading experience before trading. Seek independent financial advice if necessary before opening an account with BCR.

 English
 简体中文
简体中文
 繁體中文
繁體中文
 Bahasa
Melayu
Bahasa
Melayu
 Tiếng
Việt
Tiếng
Việt
 ไทย
ไทย
 日本語
日本語
 한국어
한국어
 ភាសាខ្មែរ
 español