


0
US Dollar Index
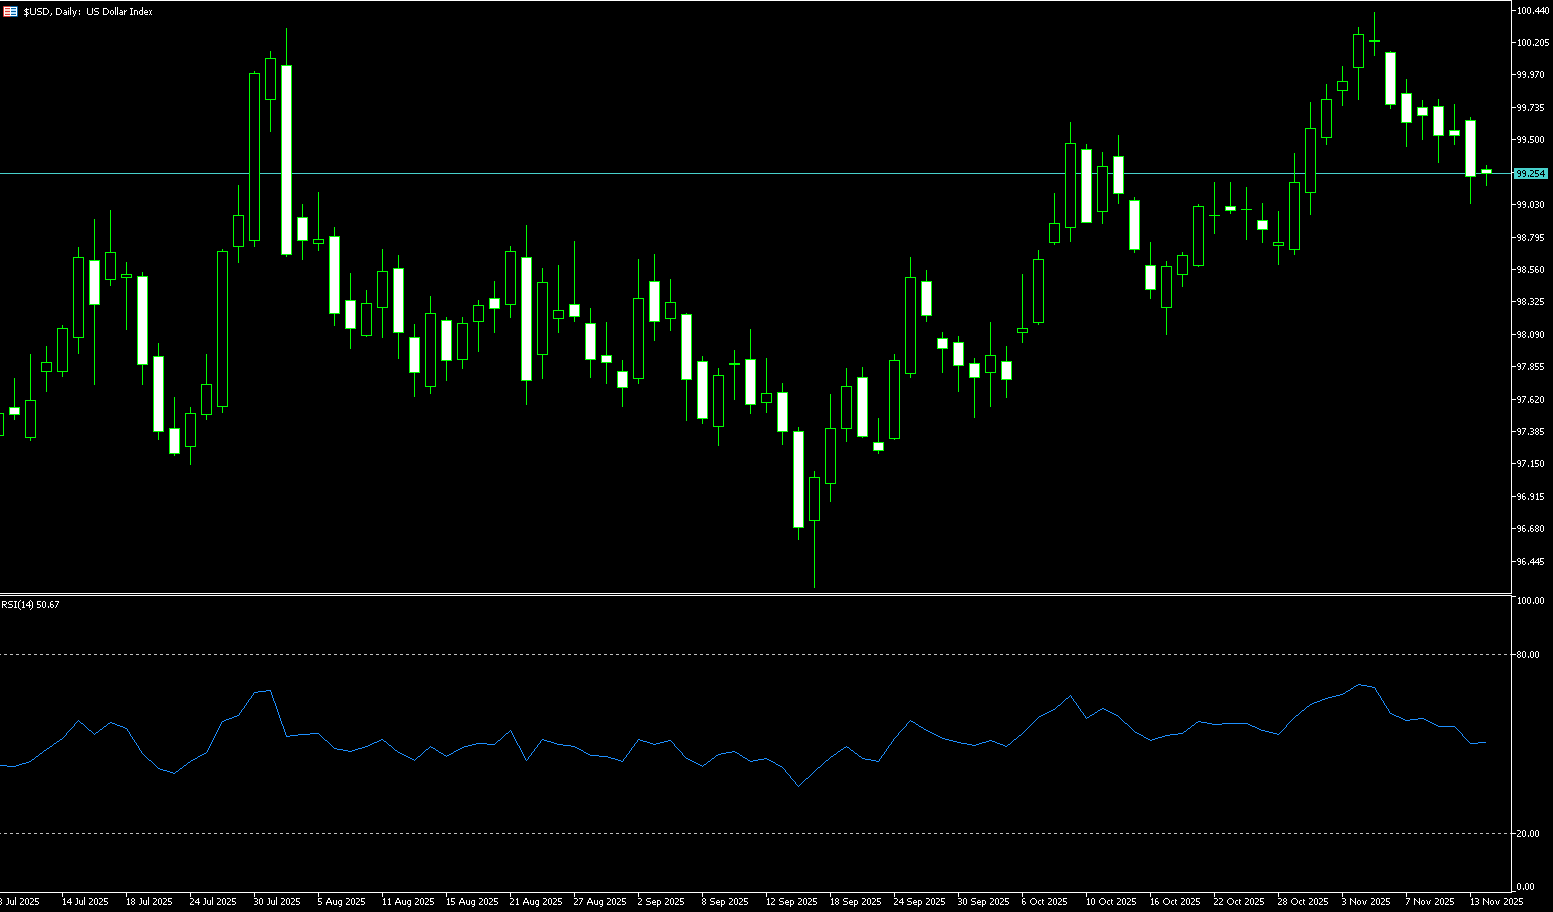
The US dollar index fell below 99.0 on Wednesday, near its lowest level since the end of October last year, after the Federal Reserve cut interest rates by 25 basis points but indicated that there would only be one rate cut in 2026. More notably, the Fed's statement made minor adjustments regarding "the extent and timing of additional adjustments," suggesting that officials may pause further rate cuts in January to await additional data to better assess the economic outlook. The latest forecasts show a substantial improvement in the growth outlook. Policymakers now expect economic growth of 2.3% next year, up from 1.8% in September. Growth in 2027 is also slightly higher at 2%, from 1.9% previously. Meanwhile, the Fed lowered its 2025 inflation forecast to 2.5% from 2.6%, although still above the central bank's 2% target.
From a technical perspective, after weeks of controlled selling, the US dollar index has formed a clear bottom. The persistent buying pressure below the price suggests that downward momentum may have largely exhausted itself. The long lower shadow and the mid-range structure reflect a two-way liquidity struggle in the market. The resulting pattern is that the US dollar index is neither able to continue its downward trend nor possesses upward momentum; it can only await new news to stimulate the market. The daily chart of the US dollar index shows that it has broken through two key resistance levels: the first key resistance level is 99.00 (a psychological level), and the 99.47 area (the 20-day simple moving average). Key support levels are at 98.63 (the 100-day simple moving average) and 98.03 (the low of October 17th).
Today, consider shorting the US Dollar Index around 98.80; Stop loss: 98.90; Target: 98.35; 98.25
WTI Crude Oil
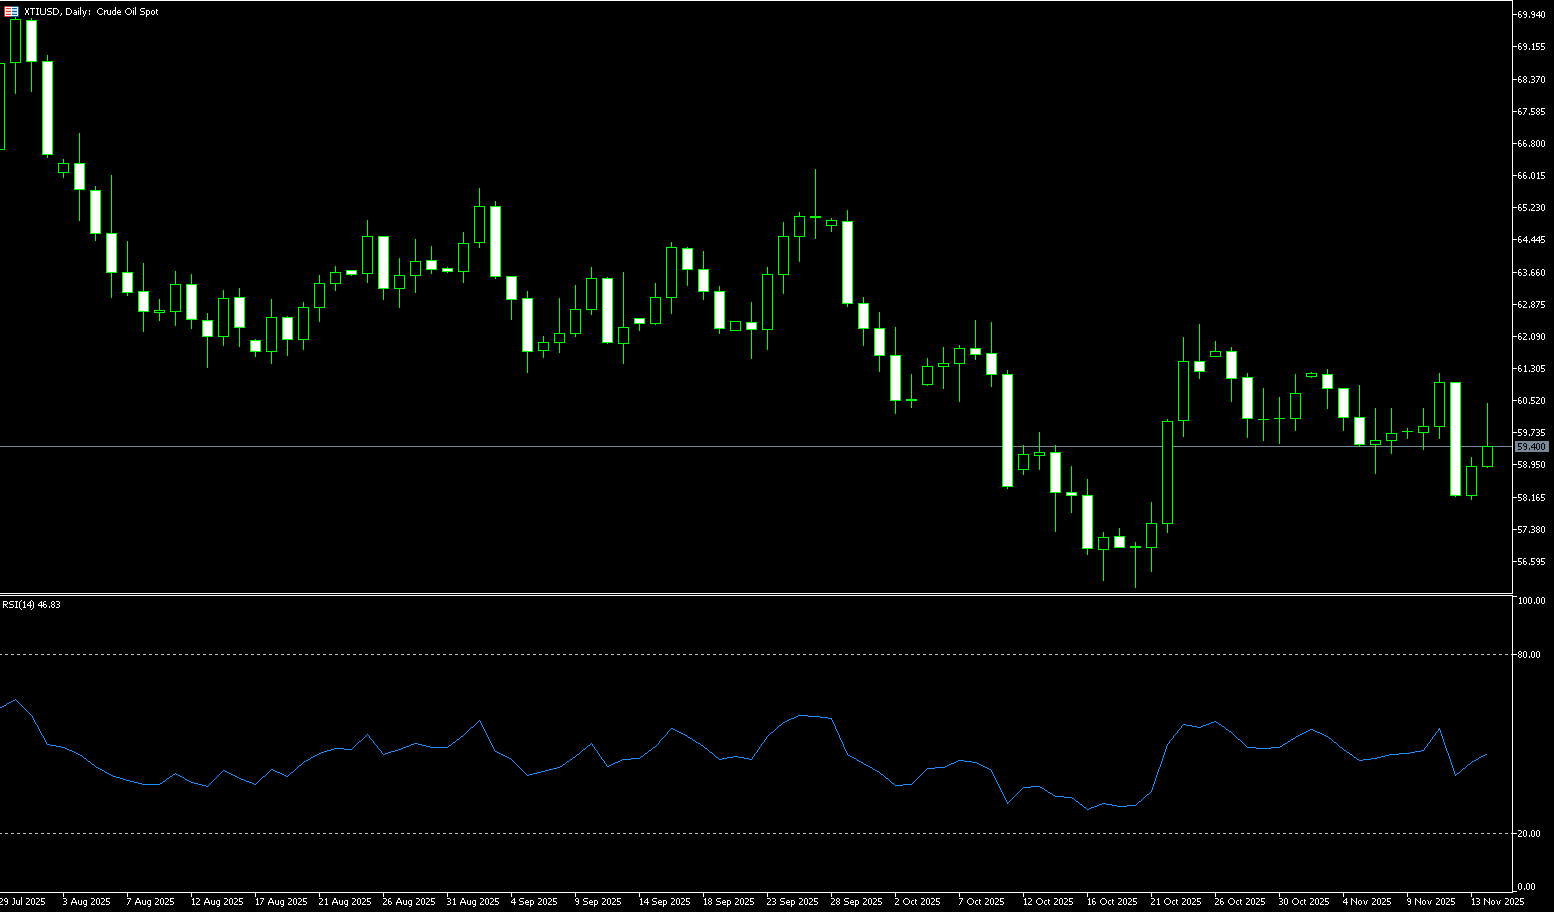
US crude oil is trading around $58.70 per barrel. Oil prices fell mid-week, with market focus on progress in the Russia-Ukraine peace talks, ample supply, and the upcoming Federal Reserve interest rate decision. The market is closely watching the peace talks that could end the Russia-Ukraine war. Analysts worry that if an agreement is reached and sanctions against Russia are lifted, it could release more crude oil supply, putting pressure on prices. Furthermore, concerns about ample supply persist following the resumption of production at Iraq's world-class oil fields. Although the market widely expects the Federal Reserve to cut interest rates this week, which typically benefits oil demand, analysts are cautious about the short-term effect of a rate cut on oil prices. Investors are remaining on the sidelines ahead of the decision, and oil prices are expected to fluctuate within a narrow range in the near term.
The resumption of production at Iraqi oil fields, coupled with the Russia-Ukraine stalemate, has created a floor for oil prices, adding further pressure from the technical aspects. On the other hand, the protracted Russia-Ukraine conflict, ongoing energy sanctions, and high geopolitical risks provide a floor for oil prices. From a daily chart technical perspective, crude oil prices have been trading within a downward-sloping parallel channel since October 2023, which in turn contains a descending channel that began in June 2025. This multi-layered structure reinforces the broader bearish bias and establishes key levels that crude oil prices must break through to shift from short-term volatility to a more constructive long-term outlook. The first upside resistance level for current crude oil prices is the psychological level of $60.00. The next major resistance level is at $62.60, aligning with the upper trendline of the six-month channel. If prices continue to trade below the $58.00-$58.17 level, the decline could extend to the previous low support zone of $57.10.
Today, consider going long on spot crude oil around 58.60; Stop loss: 58.40; Target: 59.60; 59.80
Spot Gold
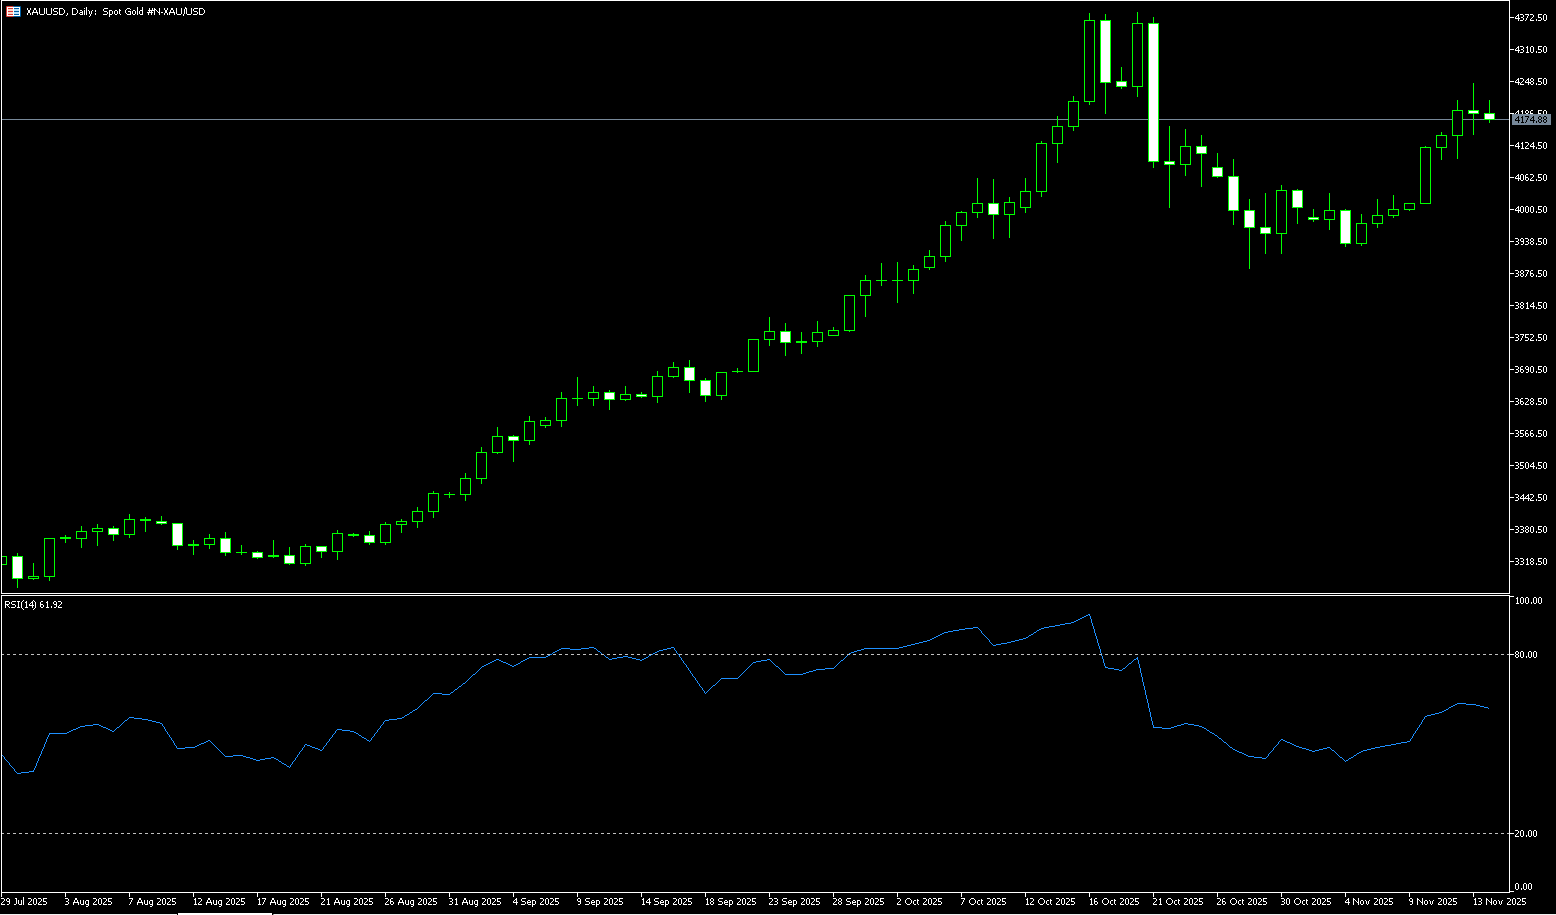
On Wednesday, gold prices broke through $4,230 per ounce, testing the October high and reaching a new all-time high, as the market interpreted the Federal Reserve's decision and digested Chairman Powell's post-meeting remarks. The committee expects to cut interest rates again next year, but Powell's wording regarding whether to stop now, cut "slightly," or cut "more" was interpreted as opening the door to additional easing, prompting traders to increase the probability of two or more cuts in 2026 to about 68%. At the same time, the statement fine-tuned the extent and timing of additional adjustments, indicating a possible pause to assess upcoming data, making the pace of cuts conditional. Policymakers also raised the growth outlook while cutting inflation forecasts for 2025 and 2026; this combination lowered short-term real interest rates, putting pressure on the dollar, while keeping long-term real yields from collapsing.
The daily chart for spot gold shows that the price broke below the lower trendline of the ascending channel and fell below $4,264.50 (last week's high), indicating a less optimistic trend. This can currently be seen as a rebound after the break below, and the price needs to close above the 9-day simple moving average at $4,212 to support further bullish momentum. However, if the price continues to fluctuate around $4,200 without a significant decline, news events could trigger a rapid upward move towards $4,264.50 (last week's high) and $4,271 (the upper Bollinger Band on the daily chart). If the price breaks below $4,200 (a psychological level), the short-term levels of $4,154 (the 20-day simple moving average) and $4,100 will once again become the focus of the market—this price level is not only an important psychological barrier but also the starting point of this latest upward trend.
Today, consider going long on spot gold around 4,224; Stop loss: 4,220; Target: 4,250; 4,260
AUD/USD
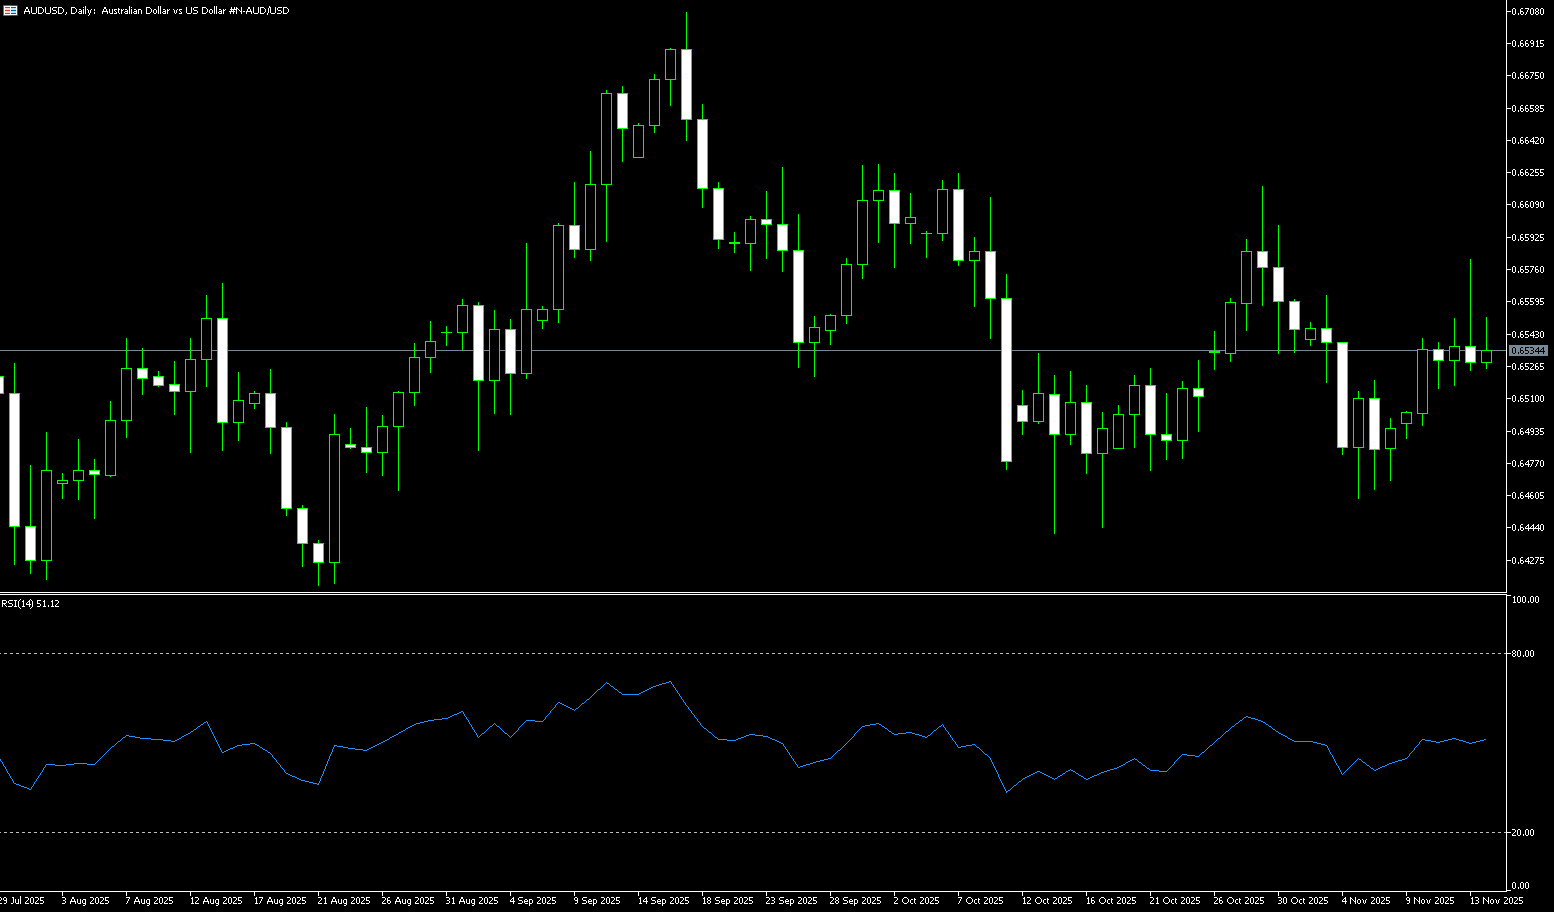
The Australian dollar is trading around US$0.6670, near its highest level in nearly three months, supported by the Reserve Bank of Australia's hawkish monetary policy outlook. The RBA kept the cash rate stable at its December meeting as widely expected, while Governor Michelle Bullock unexpectedly took a distinctly hawkish stance on interest rates, ruling out further rate cuts and indicating that rates might be raised in February if inflation does not slow. The US dollar remained volatile overall, with the dollar index only rebounding slightly near a five-week low, reflecting widespread market expectations that the Federal Reserve is about to begin a rate-cutting cycle. Meanwhile, among non-US dollar currencies, the Australian dollar performed particularly well, rising for the twelfth consecutive trading day against the US dollar, briefly approaching the key psychological level of 0.6685, reaching a new high in more than three months.
The technical pattern of the Australian dollar against the US dollar shows a clear upward trend. The twelve consecutive days of gains have not only broken through multiple short-term resistance levels but also formed a stable bullish pattern on the daily chart. The exchange rate is currently at 0.6670, having returned to and surpassed the previous key level, indicating a shift in the center of gravity upwards. The 0.6700 area above corresponds to the overlap of the previous high and a psychological barrier, presenting some technical resistance in the short term. The MACD indicator shows the fast and slow lines diverging upwards, with the histogram continuing to expand, reflecting continued upward momentum; however, the RSI (14) is around 70, approaching overbought territory, suggesting potential volatility and a slowdown in the upward movement. On the downside, the first support level to watch is 0.6600 (a psychological barrier), followed by the structural support at the December 3rd low of 0.6553. The AUD/USD buy/sell line is near 0.6537, the intersection of the 50-day and 100-day simple moving averages. If a pullback can maintain consolidation at higher levels, it will be beneficial for the continuation of the trend's stability, opening the door to this year's high of 0.6707. A break above 0.6707 would expose the psychological level of 0.6800 as the next upside target.
Consider going long on the Australian dollar today around 0.6663; Stop loss: 0.6650; Target: 0.6720; 0.6730
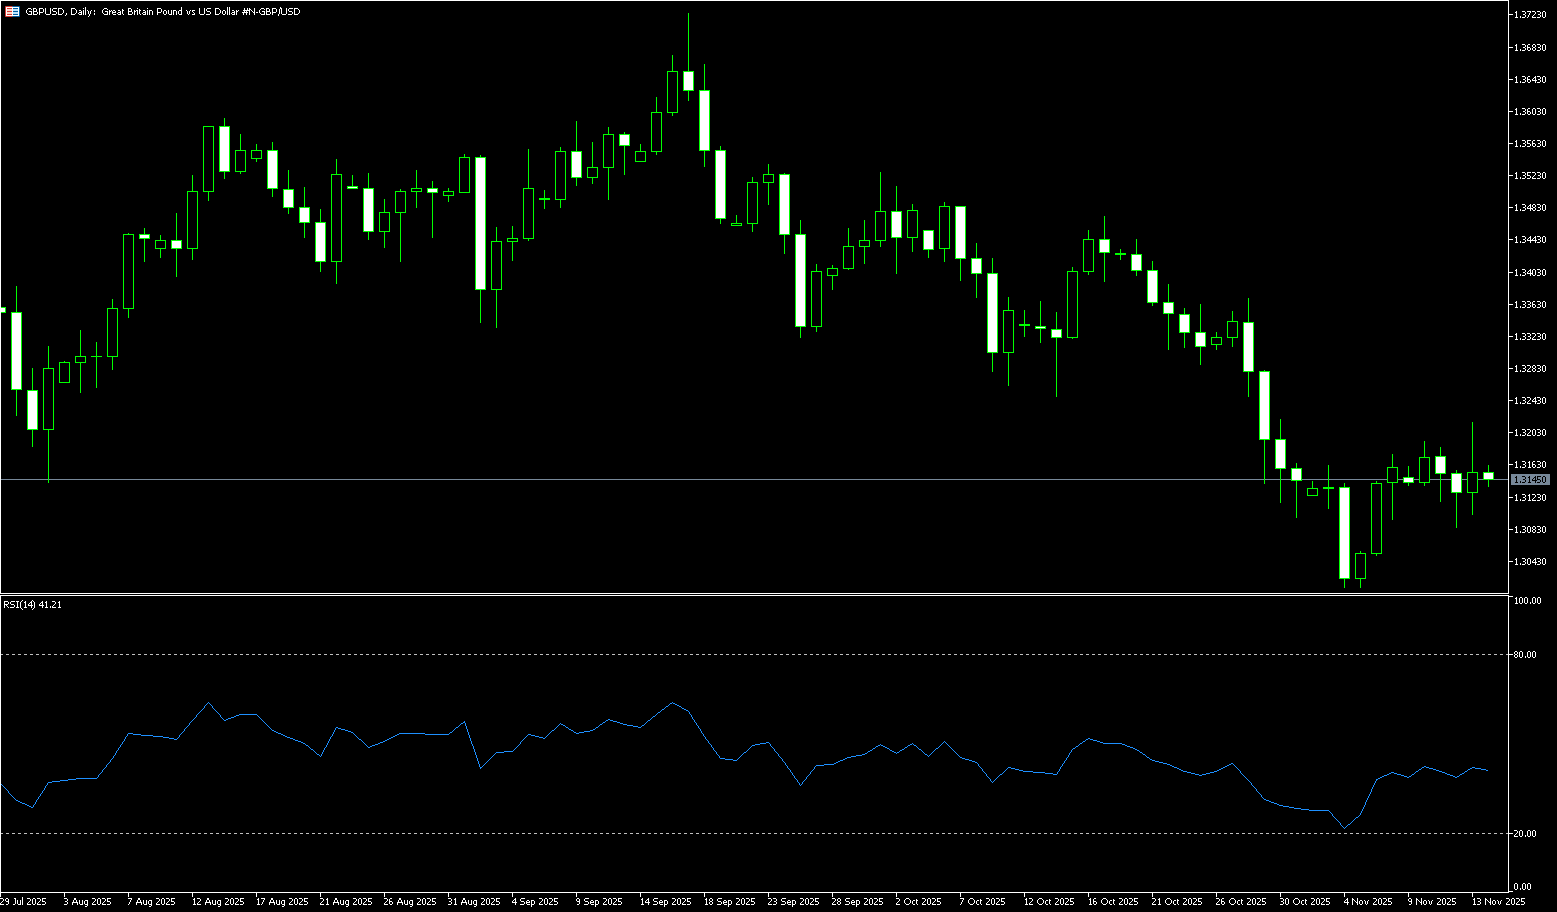
GBP/USD
The GBP/USD pair rose on Wednesday after the Federal Reserve decided to cut interest rates as expected, with a 9-3 vote. Two members voted to keep rates unchanged, while Fed Governor Stephen Miran voted for a 50 basis point cut. As of this writing, the pair is trading at 1.3389, up to a near one-month high. The Federal Open Market Committee (FOMC) vote was 9-3: Governor Stephen Miran opposed a 50 basis point cut, while Jeffrey Schmid and Austan Goolsbee favored keeping rates unchanged.The Summary of Economic Projections (SEP), including an updated bitmap, shows that most officials expect the federal funds rate to be close to 3.4% next year, implying only one 25 basis point rate cut in 2026, according to the median.
The daily chart for the pound shows that the exchange rate broke through the "double bottom" pattern at 1.3038 last month, reaching the measured upside target of around 1.3344. Currently, the exchange rate has tested the 1.3385 (December 4 high) and 1.3400 (psychological level) areas without success, and a pullback is expected. If it breaks below the psychological level of 1.3300 and Tuesday's low of 1.3287, the next targets will be 1.3247 (14-day simple moving average) and the 1.3200 (psychological level). Meanwhile, once the pound bulls rebound, the first target is the psychological level of 1.3400, with a further target of 1.3454 (the high of October 16th).
Consider going long on the pound today around 1.3365; Stop loss: 1.3353; Target: 1.3430; 1.3340
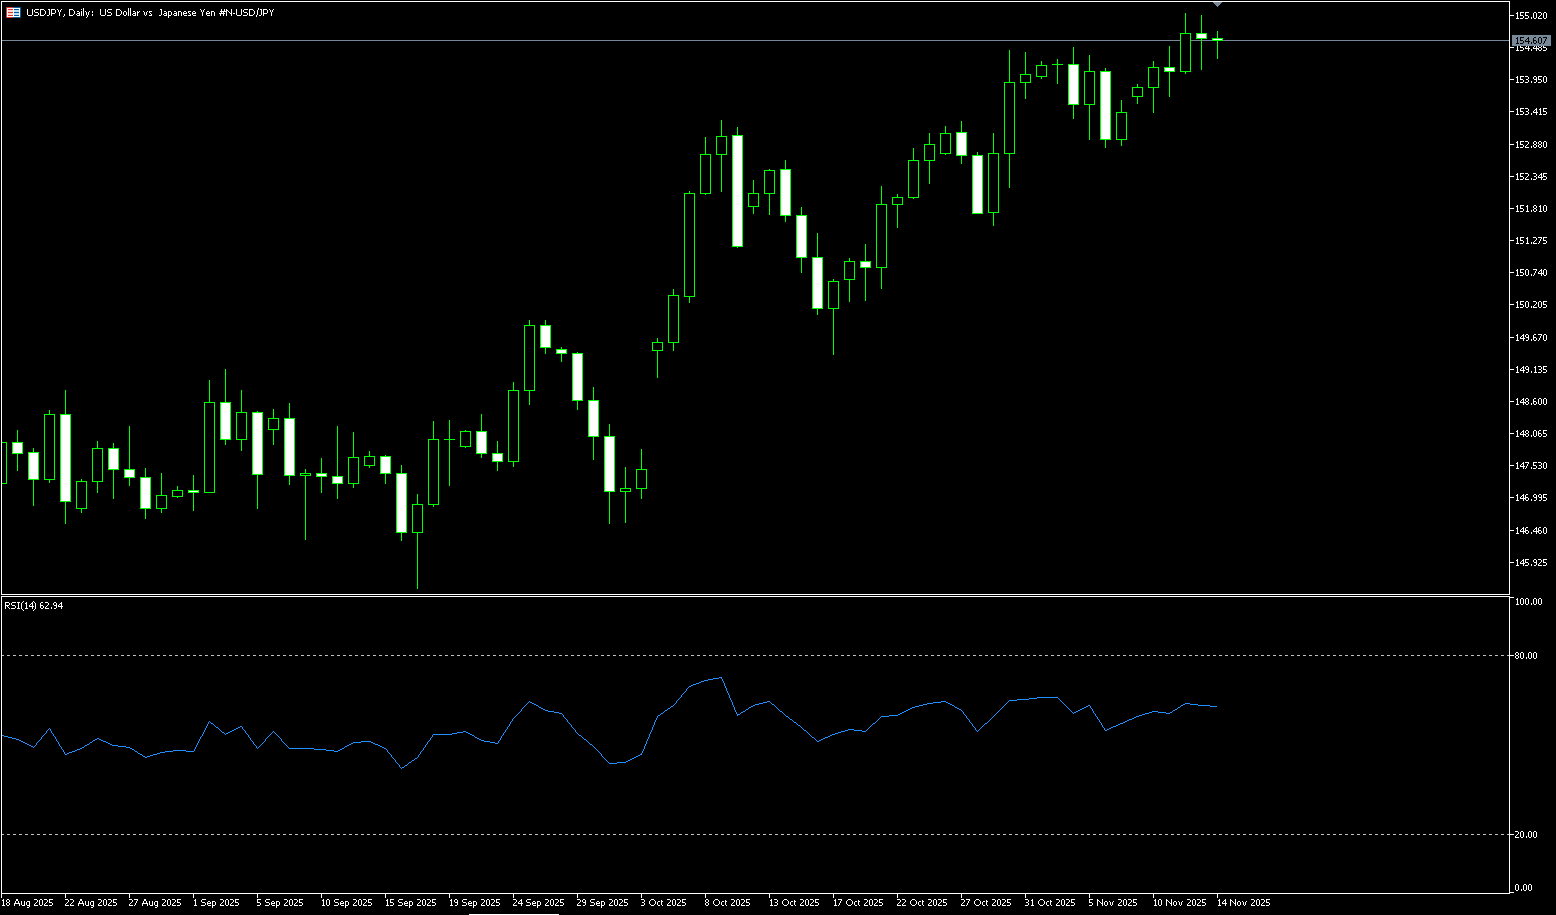
USD/JPY
The yen traded around 156 yen per dollar on Wednesday after three days of sharp declines, despite Bank of Japan Governor Kazuo Ueda stating that the central bank is gradually approaching its inflation target, hinting at a possible rate hike in the near future. The market is pricing in a possible rate hike by the Bank of Japan next week, with focus on Ueda's post-meeting comments for guidance on policy plans for next year. The yen also faces growing pressure from concerns about Japan's fiscal health due to Prime Minister Sanae Takaichi's massive spending plans. Furthermore, the wide interest rate differential between Japan and other major economies encourages short bets, as domestic interest rates remain among the lowest globally. The yen weakened across the board, hitting a record low against the euro.
The dollar approached its lowest level since the end of October, exerting significant downward pressure on the USD/JPY pair. However, it initially faced pressure following the 7.5 magnitude earthquake off the northeast coast of Japan, temporarily raising concerns about economic disruption. Coupled with the uncertainty surrounding the interest rate path, investors are currently waiting for the Federal Reserve's updated economic forecasts and Chairman Powell's speech. The USD/JPY pair rebounded to near a one-week high around 157. Technically, if the USD/JPY pair rebounds, initial resistance is around 156.74 (the high of November 27th). A break above this level could lead to a return to 157.41 (the upper Bollinger Band), ultimately approaching the psychological level of 158.00. Technical indicators suggest that due to the bearish hourly chart, intraday declines may find support around 155.12 (the 30-day simple moving average) and the 155.00 psychological level. A break below these levels could lead to further testing of the 154.35 level (last Friday's low).
Today, consider shorting the US dollar around 156.30; Stop loss: 156.50; Target: 155.30; 153.20
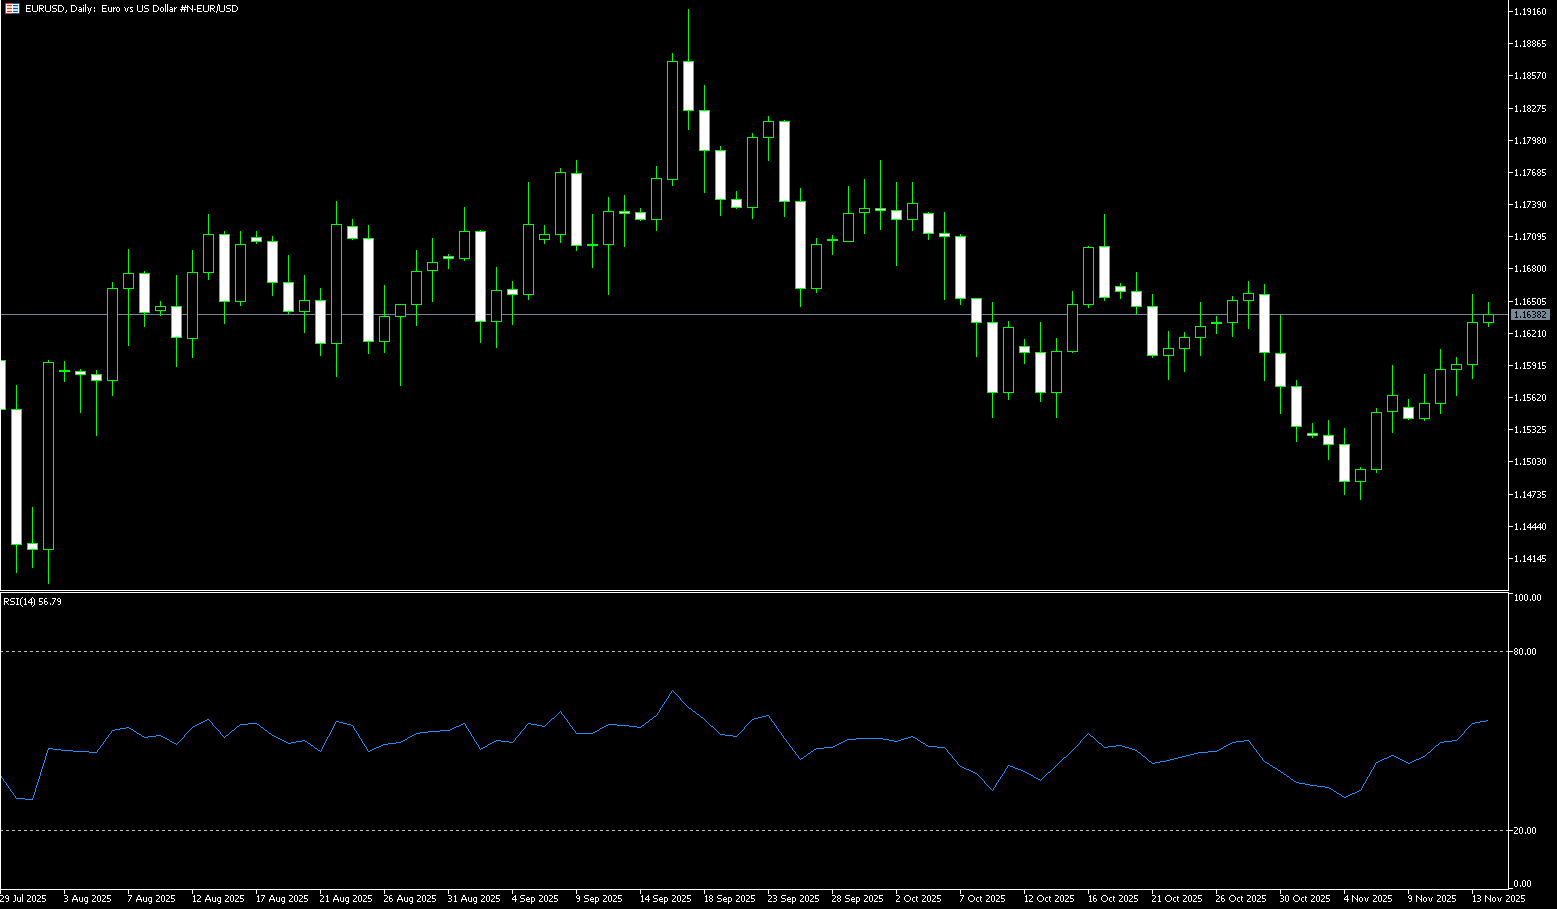
EUR/USD
On Wednesday, the euro/dollar pair experienced sharp bullish volatility following the Federal Reserve's third consecutive rate cut. The pair tested its highest intraday buying volume in nearly a week. EUR/USD quickly broke free from a four-day pullback, challenging the 1.1700 resistance level, as investors continued to assess the Fed's rate cuts and Chairman Powell's neutral message, leading to a significant sell-off in the dollar. The focus now shifts to Thursday's US labor market weekly report. Following the Fed's rate decision, Chairman Powell held a cautious press conference, noting that the third consecutive rate cut put the Fed in a "comfortable" position to wait and see before making a clearer interest rate decision.
From the daily chart, the Euro/USD pair completed a surge and subsequent pullback near the previous high of 1.1778, then dipped to 1.1541 before rebounding and falling further to a low of 1.1468. The recent upward move pushed from 1.1468 to the 1.1700 level, and it is currently holding above 1.1650. The 1.1700 level is a key support/resistance level: it serves as both a support zone for recent pullbacks and a concentration of short-term trading costs. A repeated breach of this level could lead to a retest of the 1.1650 or even 1.1600 support zone. Conversely, holding and reclaiming 1.1650 would constitute a "pullback confirmation followed by another upward move," targeting the 1.1700 resistance level. The 1.1700 level is a typical static resistance level; a significant breakout with substantial volume is more likely to open up space towards 1.1750 and the previous high of 1.1778.
Consider going long on the Euro today around 1.1680; Stop loss: 1.1670; Target: 1.1740; 1.1750
Disclaimer: The information contained herein (1) is proprietary to BCR and/or its content providers; (2) may not be copied or distributed; (3) is not warranted to be accurate, complete or timely; and, (4) does not constitute advice or a recommendation by BCR or its content providers in respect of the investment in financial instruments. Neither BCR or its content providers are responsible for any damages or losses arising from any use of this information. Past performance is no guarantee of future results.
Lebih Liputan


Pendedahan Risiko:Instrumen derivatif diniagakan di luar bursa dengan margin, yang bermakna ia membawa tahap risiko yang tinggi dan terdapat kemungkinan anda boleh kehilangan seluruh pelaburan anda. Produk-produk ini tidak sesuai untuk semua pelabur. Pastikan anda memahami sepenuhnya risiko dan pertimbangkan dengan teliti keadaan kewangan dan pengalaman dagangan anda sebelum berdagang. Cari nasihat kewangan bebas jika perlu sebelum membuka akaun dengan BCR.
BCR Co Pty Ltd (No. Syarikat 1975046) ialah syarikat yang diperbadankan di bawah undang-undang British Virgin Islands, dengan pejabat berdaftar di Trident Chambers, Wickham’s Cay 1, Road Town, Tortola, British Virgin Islands, dan dilesenkan serta dikawal selia oleh Suruhanjaya Perkhidmatan Kewangan British Virgin Islands di bawah Lesen No. SIBA/L/19/1122.
Open Bridge Limited (No. Syarikat 16701394) ialah syarikat yang diperbadankan di bawah Akta Syarikat 2006 dan berdaftar di England dan Wales, dengan alamat berdaftar di Kemp House, 160 City Road, London, City Road, London, England, EC1V 2NX. Entiti ini bertindak semata-mata sebagai pemproses pembayaran dan tidak menyediakan sebarang perkhidmatan perdagangan atau pelaburan.

 English
 简体中文
简体中文
 繁體中文
繁體中文
 Bahasa
Melayu
Bahasa
Melayu
 Tiếng
Việt
Tiếng
Việt
 ไทย
ไทย
 日本語
日本語
 한국어
한국어
 ភាសាខ្មែរ
 español