


0
US Dollar Index
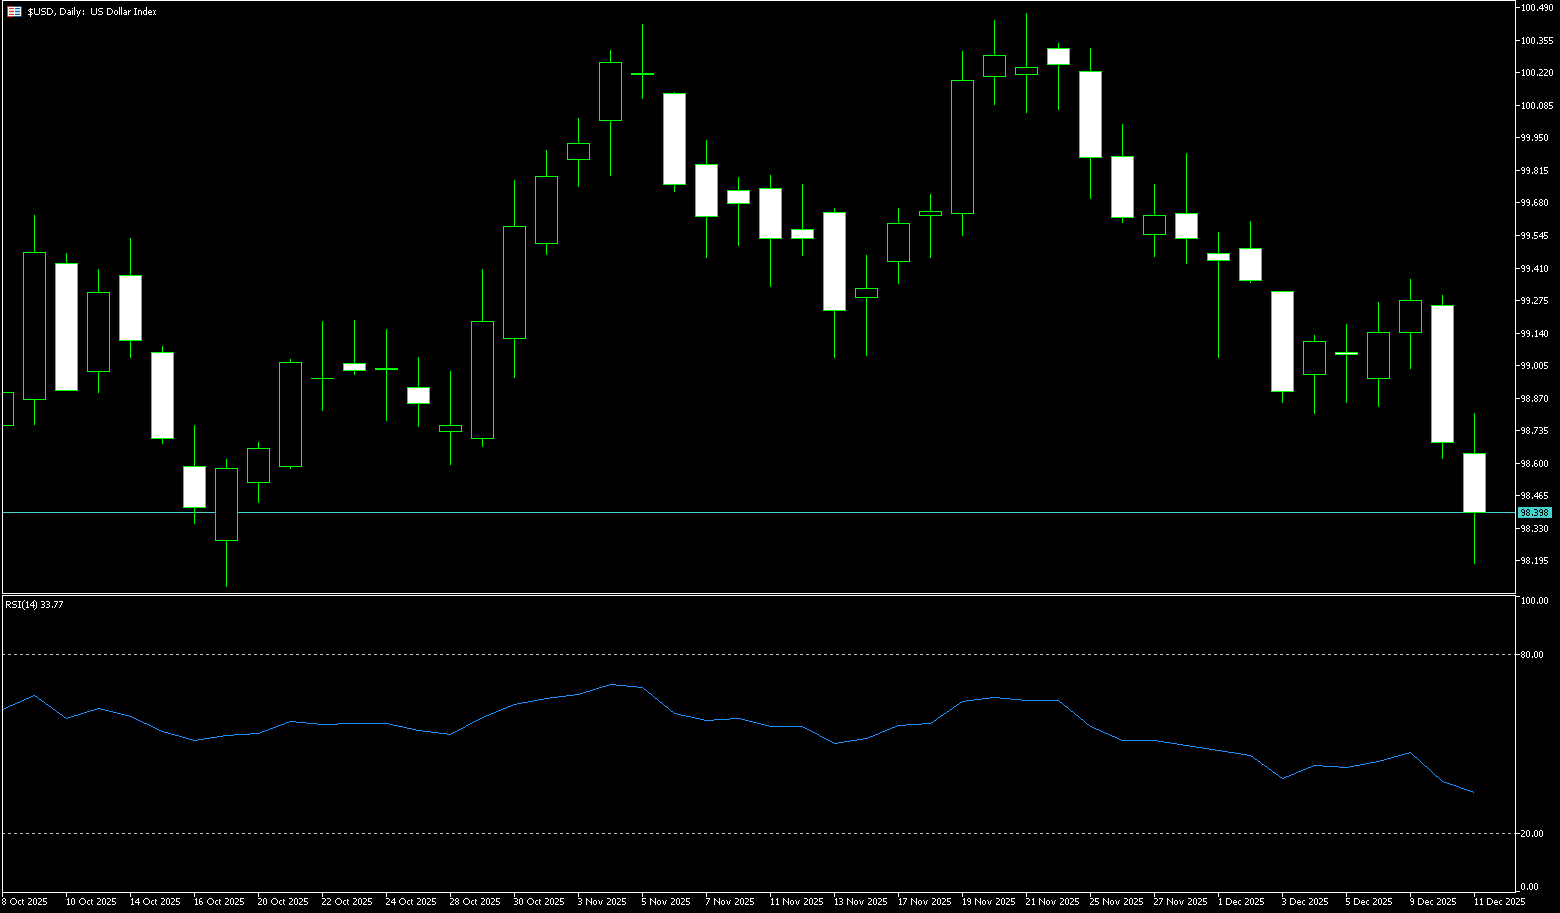
The US dollar weakened significantly against major currencies after the Federal Reserve announced an interest rate cut. The Fed lowered the target range for the federal funds rate by 25 basis points to 3.50%-3.75%, in line with market expectations, but the three policymakers disagreed on the decision. A key point was that the Fed hinted in its policy statement that it might pause rate cuts at its next meeting in January to assess more economic data. Further pressure on the dollar came from Fed Chairman Powell's remarks. He explicitly stated at the press conference that the policymakers' "baseline scenario" did not include future rate hikes, and that the next step was "unlikely to be a rate hike." This caused the dollar index to fall. Analysts pointed out that market concerns about slowing economic growth and a cooling labor market are offsetting the Fed's cautious stance on inflation, jointly contributing to the dollar's weakness.
Overall, the current weakness of the dollar index is a result of both "expectations of rate cuts" and a more dovish policy tone. A short-term rebound may depend on support from economic data. The US dollar index remains near the lower end of the 98.20-99.20 range, with bearish momentum continuing to dominate. On the daily chart, the dollar index has closed below the 5-day and 10-day moving averages for several consecutive days, indicating insufficient upward momentum. The MACD continues to widen its death cross, with the bearish histogram extending, suggesting a further downward bias. The RSI remains around 40, not yet fully oversold, but the weak upward momentum indicates the dollar is still searching for a new equilibrium. Key support level: 98.14 (Thursday's low): A decisive break below this level would open up potential for a move towards 98.00 (the psychological level), and even 97.80. Resistance: 99.10: Short-term resistance; failure to break through this level will likely lead to a continuation of the dollar's weak structure. Key resistance level: 99.50: A confirmation zone for a short-term trend reversal.
Today, consider shorting the US Dollar Index around 98.46; Stop loss: 98.60; Target: 98.05; 98.00
WTI Crude Oil
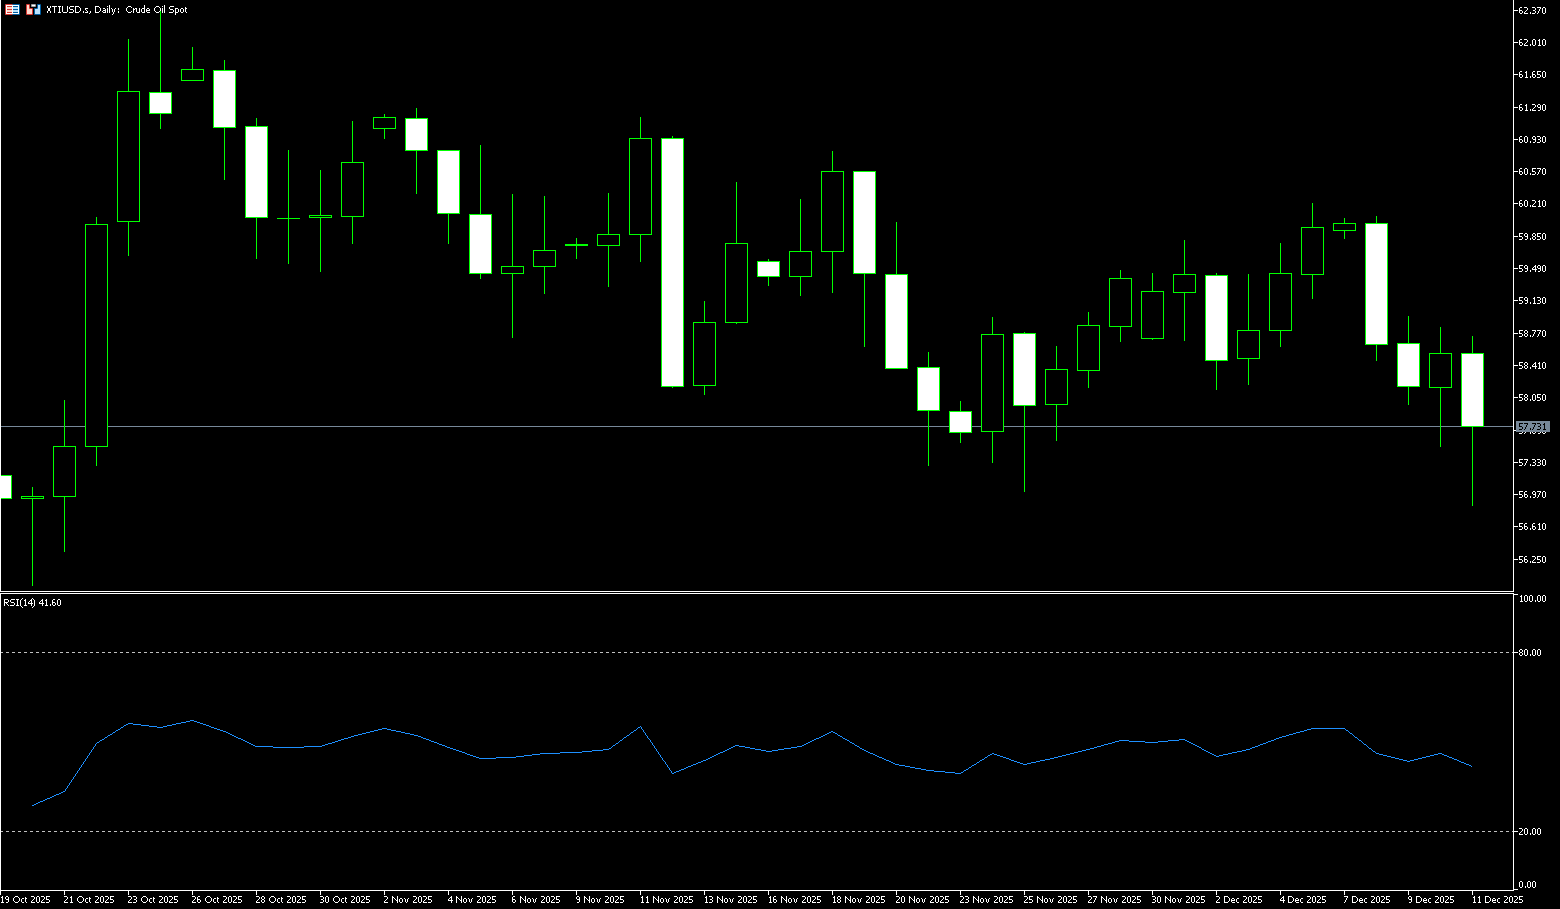
US crude oil traded around $57.80 per barrel. Oil prices closed higher on Wednesday, mainly influenced by news of the US seizure of an oil tanker near Venezuela, exacerbating market concerns about short-term oil supply. On the news front, two US officials confirmed that the US Coast Guard seized an oil tanker off the coast of Venezuela, but did not disclose the specific name or exact location of the vessel. Analysts pointed out that this move exacerbated market concerns about the stability of oil supplies from sanctioned countries such as Venezuela, Iran, and Russia. Analysts said that if more similar seizures occur, it could trigger more volatile oil prices. In addition, the Federal Reserve announced a 25 basis point rate cut, but Powell did not provide clear guidance on the future path of rate cuts, stating that policy is prepared to respond to economic changes. On the supply and demand front, data from the U.S. Energy Information Administration (EIA) showed that U.S. crude oil inventories fell by 1.8 million barrels last week, less than the market expectation of 2.3 million barrels.
Overall, the structural surplus in the global market is a key variable suppressing oil prices, while weakening inventory data and supply and demand prospects make it difficult for oil prices to break out of their range in the short term. The MACD indicator's momentum bars are shortening, and the RSI is hovering in the neutral zone, indicating that market sentiment remains cautious. This means that without clear bullish drivers, oil prices are unlikely to break through the upper resistance zone in the short term, and supply-side pressure is expected to continue to dominate the medium-term direction. From a technical perspective, WTI prices continue to fluctuate narrowly between $57.50 and $60.00, with the candlestick pattern showing limited bullish strength. Prices have repeatedly encountered resistance near $60 (a psychological level) and $61.58 (the 100-day simple moving average), while the $57.50 area and the previous low of $57.10 area have formed temporary support, resulting in a weak sideways trend in the short term.
Today, consider going long on spot crude oil around 57.55; Stop loss: 57.40; Target: 59.00; 59.20
Spot Gold
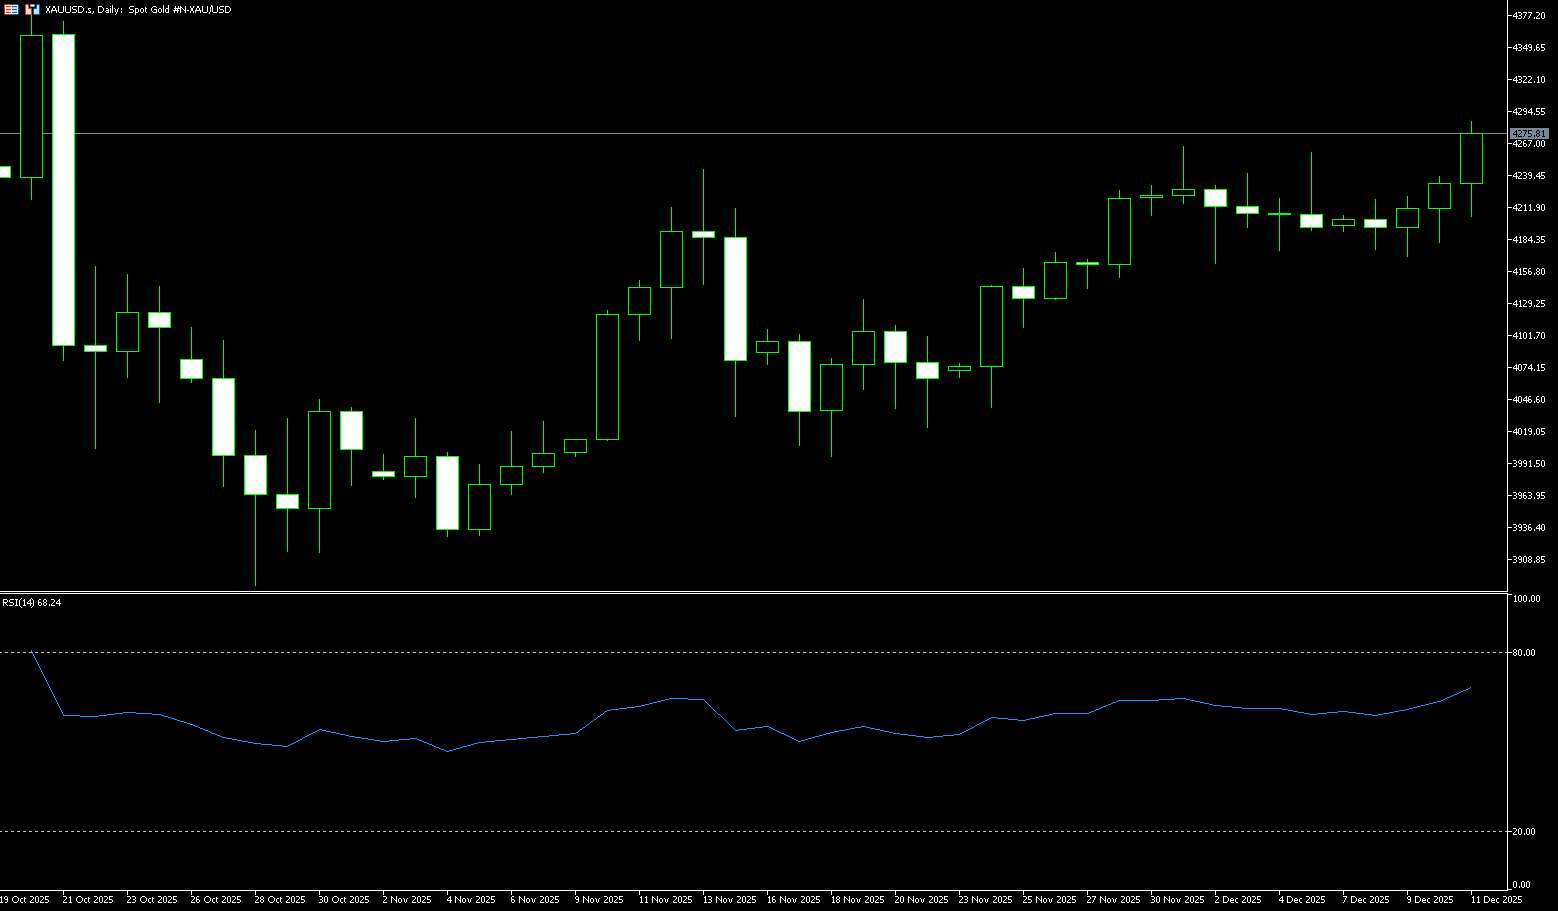
Gold prices broke through $2,260 per ounce on Thursday, rebounding after a pullback from October highs, as the market priced in the Federal Reserve's actions and its technical liquidity steps. The Fed implemented the expected 25 basis point rate cut, and Chairman Powell's comments were seen as dovish, prompting traders to increase the likelihood of further easing; however, the policy statement and dot plot still indicated that the pace of rate cuts was conditional. Meanwhile, the Fed announced it would begin purchasing approximately $40 billion in short-term Treasury bonds to ease pressure in the money market, a move that should limit upward pressure on short-term yields and support precious metals. A weaker dollar to mid-98 and a drop in the US 10-year yield to a low of 4% reduced the opportunity cost of holding gold bars and helped support the rebound. Geopolitical tensions and continued central bank purchases, particularly further increases in Chinese reserves, provided structural support for prices.
The pullback from resistance near the upper boundary of the two-week trading range requires caution among gold bulls. However, positive oscillators on the daily chart suggest that a further break below $4,200 could be seen as a buying opportunity, with good support expected in the $4,170-$4,165 area. However, a decisive break below the latter could expose the $4,125-$4,120 confluence – including the 200-period exponential moving average on the 4-hour chart and the uptrend line extending from the swing low at the end of October. On the other hand, bulls need to wait for sustained strength and acceptance above the $4,245-$4,250 supply zone. A subsequent rally has the potential to lift gold prices to the intermediate resistance level of $4,277-$4,278, and then towards the $4,300 level. Some follow-through buying would be seen as a key trigger for gold/dollar bulls and paves the way for additional short-term gains to the all-time high of $4,381.
Today, consider going long on spot gold around 4,272; Stop loss: 4,268; Target: 4,300; 4,310
AUD/USD
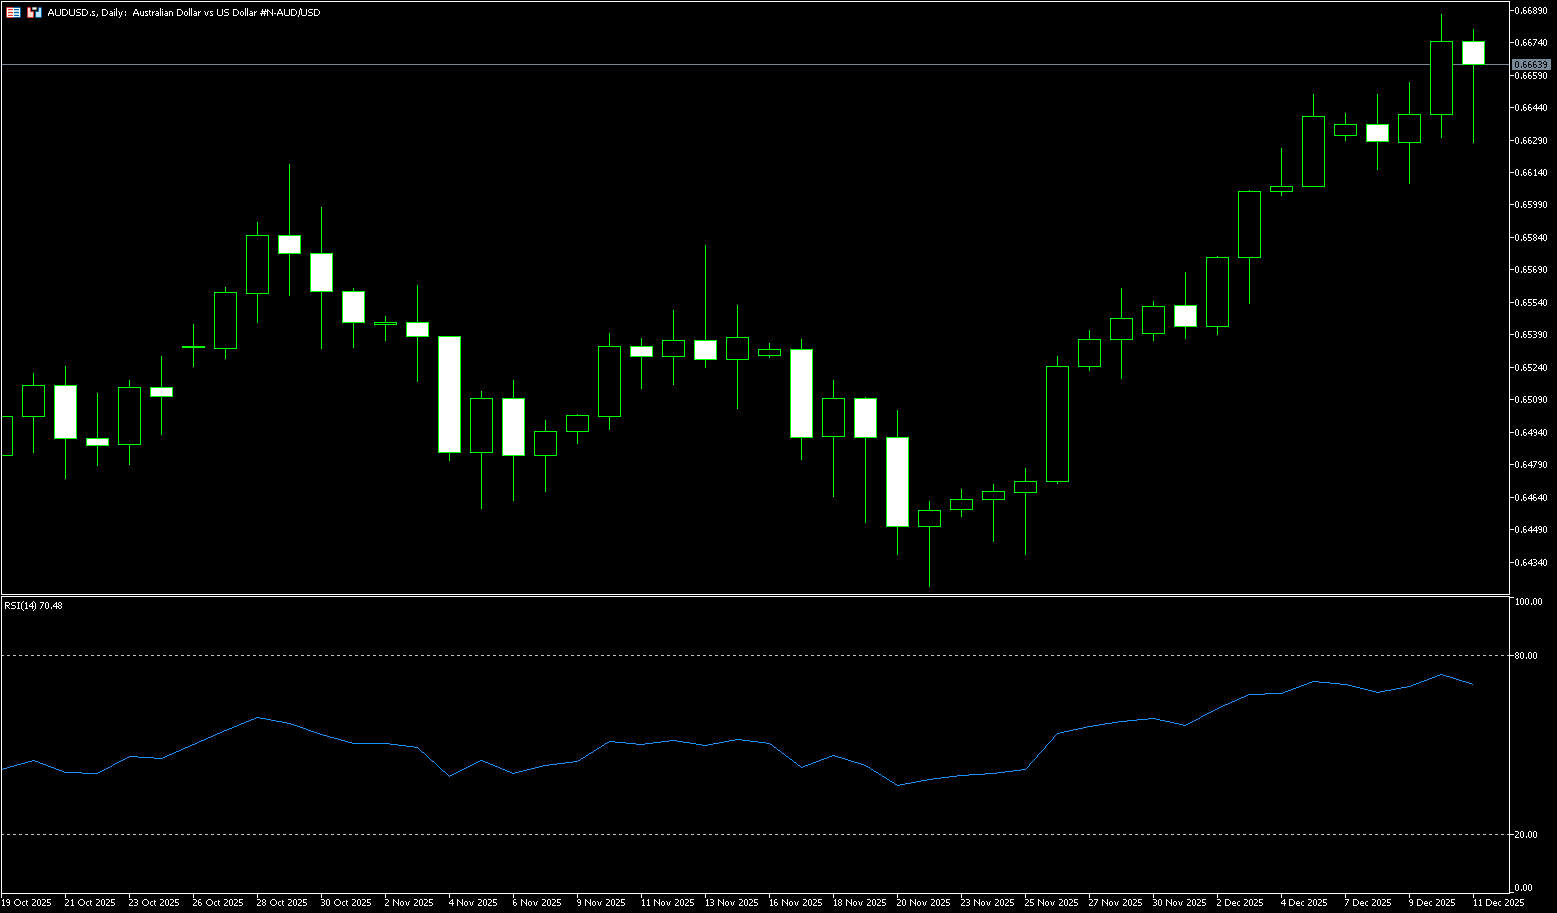
The Australian dollar stabilized near US$0.6660 on Thursday, close to a three-month high, as investors weighed the latest labor market data for clues about the Reserve Bank's policy direction. The economy unexpectedly lost a net 21,300 jobs in November, driven entirely by full-time positions, while a decrease in the number of people entering the labor market kept the unemployment rate at 4.3%. The weaker-than-expected data suggests a gradual slowdown in the labor market, prompting traders to postpone their expectations for interest rate hikes to the second half of 2026, down from the previous expectation of May. However, the central bank still considers the labor market tight, citing high job vacancies, widespread labor shortages, rising labor costs, and signs that the economy is still near full employment. Elsewhere, the Australian dollar was supported by a weaker US dollar after the Federal Reserve cut interest rates by 25 basis points, and Chairman Powell's comments after the meeting surprised the market, which had expected a more hawkish tone.
The Australian dollar remains focused on the upside against the US dollar, with an initial target of the key 0.6700 resistance level. Furthermore, momentum indicators suggest additional short-term growth: the Relative Strength Index (RSI) is trading above 67, while the Average Directional Index (ADX) is near 24, indicating a fairly solid trend. If the bulls push further, the spot pair should face the next significant resistance level at 0.6707 (September 17th), a break below which would expose the psychological level of 0.6800 as the next upside target. On the other hand, there is short-term support near the psychological level of 0.6600, below which lies the structural support of the December 3rd low of 0.6553. The AUD/USD buyer's dividing line is near 0.6537, the intersection of the 50-day and 100-day simple moving averages.
Consider going long on the Australian dollar around 0.6650 today; Stop loss: 0.6640; Target: 0.6720; 0.6730
GBP/USD
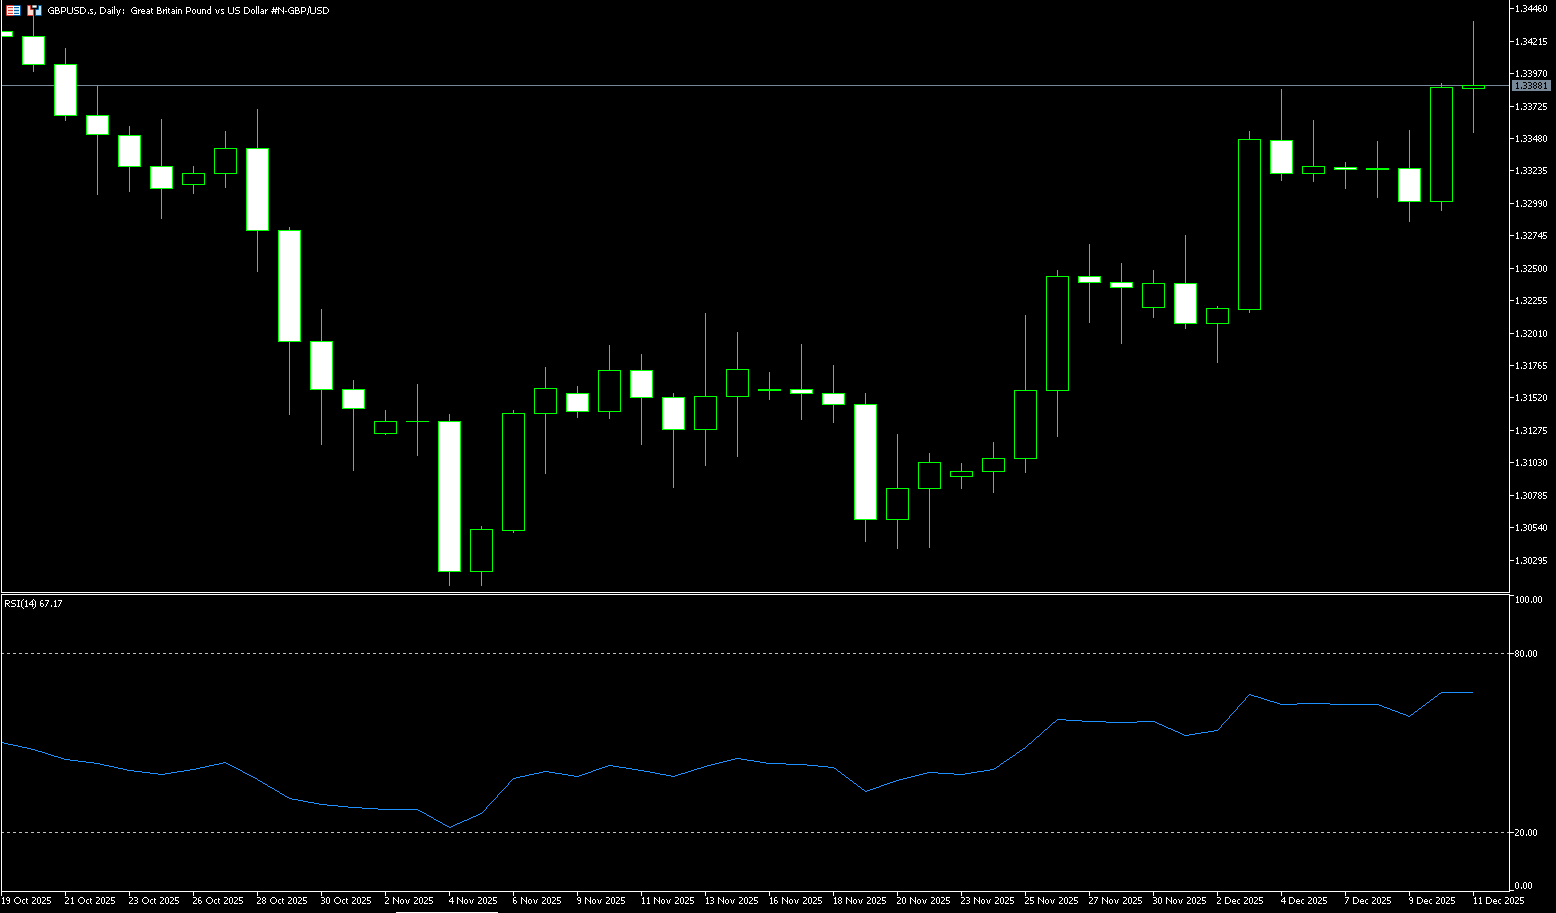
In the early European trading session on Thursday, GBP/USD traded around 1.3385, pressured by a rebounding US dollar. However, potential downside may be limited after the Federal Reserve's rate cut at its December policy meeting. Traders are preparing for the later release of the US weekly initial jobless claims report. The market continues to digest the Fed's rate cut decision on Wednesday. At the press conference, Fed Chairman Powell stated that the central bank needs time to observe how the three rate cuts this year will affect the US economy. Powell added that he will closely monitor the latest data before the next meeting in January. The Fed's economic projections indicate a rate cut next year, although new data could change that. On the other hand, the prospect of a Bank of England rate cut could drag the pound lower against the dollar.
The core contradiction in the current GBP/USD exchange rate movement lies in the policy divergence between the Fed's hawkish rate cut and the Bank of England's potential rate cut: the US dollar may find short-term support due to rate cuts and hawkish guidance, while the pound is supported by easing economic data and expectations of rate cuts. In the short term, the exchange rate may fluctuate within a range, with GBP/USD caught in a tug-of-war between the Fed's hawkish rate cut and the Bank of England's potential rate cut. From the daily chart, the pair is currently consolidating within the 1.3250–1.3400 range. The price found support near 1.3250, while the 1.3400–1.3450 area forms a resistance zone. Short-term moving averages are flat, and the MACD histogram is close to the zero line, indicating a balance between bullish and bearish forces. A break below 1.3300 (a psychological level) could lead to a pullback to the next level, targeting 1.3271 (the 14-day simple moving average) and then the 1.3200 (a psychological level). Overall, the technical analysis suggests the exchange rate will likely remain range-bound, with attention focused on policy-driven catalysts for a breakout.
Today, consider going long on the British pound around 1.3380; Stop loss: 1.3370; Target: 1.3430; 1.3340
USD/JPY
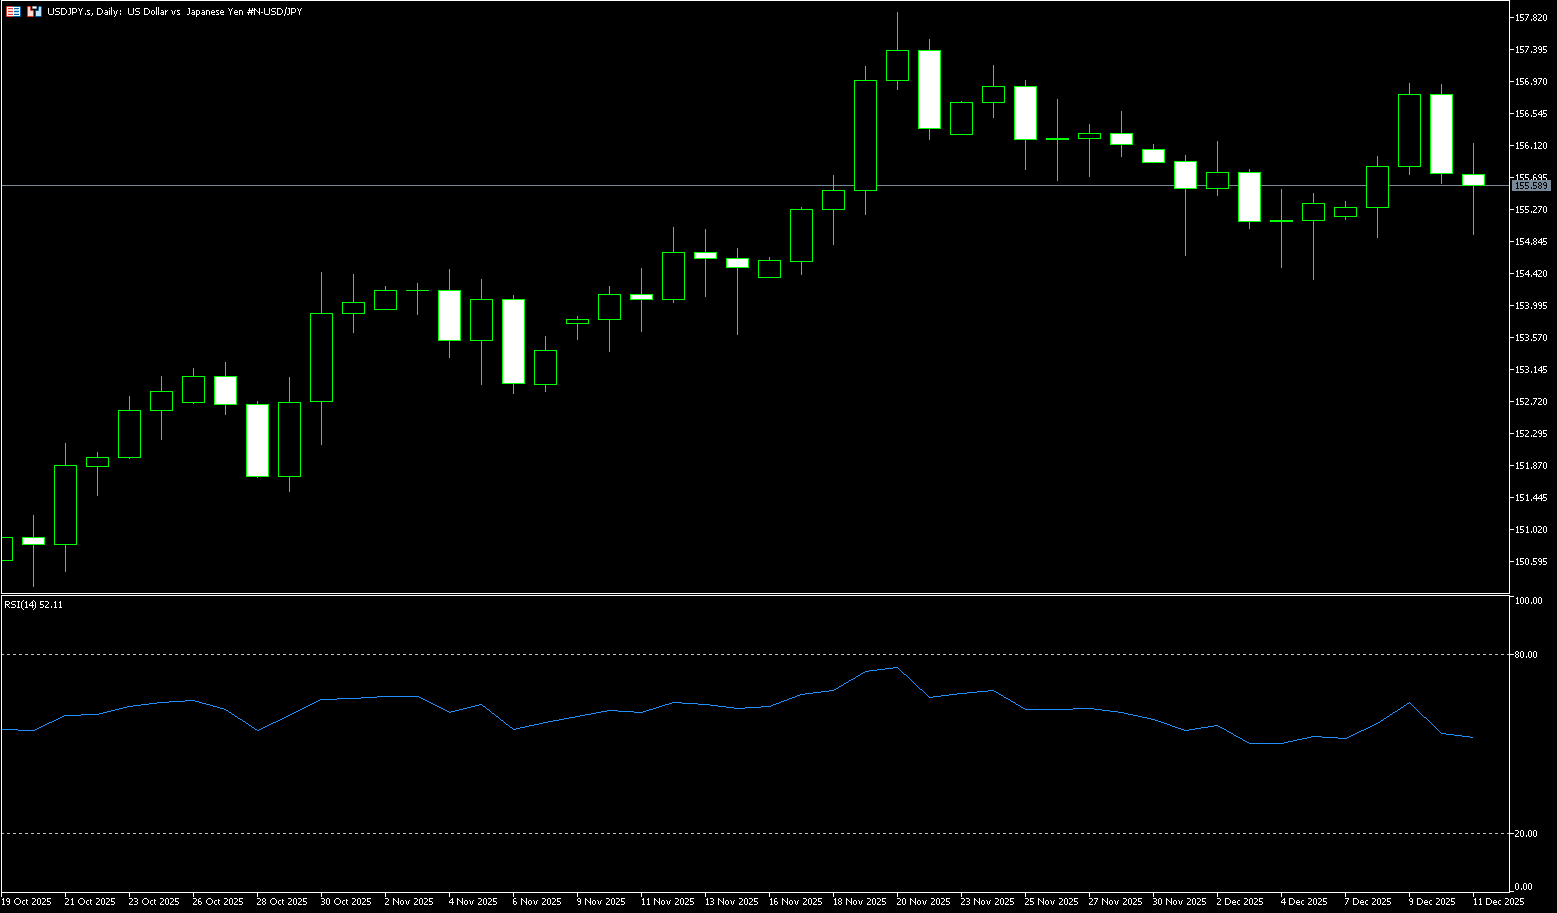
The yen strengthened against the dollar to 155.50 on Thursday, extending gains from the previous session, as the Federal Reserve announced its third rate cut this year and hinted at a more dovish outlook than the market expected, causing a sharp weakening of the dollar. Investors are also focused on the Bank of Japan's policy meeting next week, with the market anticipating a possible rate hike after Governor Kazuo Ueda indicated at the last meeting that the central bank is gradually approaching its inflation target. The focus will be on Ueda's post-meeting comments for guidance on policy in 2026. Despite recent gains, the yen remains pressured by slow Japanese economic growth, fiscal challenges, and a large interest rate gap with other major economies, as domestic interest rates remain among the lowest globally. On the data front, business confidence among large manufacturers rose to its highest level in a year in the three months to December.
The intraday break below the 156.00 level and the 100-hour simple moving average {156.08} in USD/JPY supports the possibility of further declines, although negative oscillators on the hourly chart suggest this. Nevertheless, technical indicators on the daily chart remain in positive territory, suggesting that any further declines are more likely to attract some buyers near the breakout point of 155.35-155.30. The latter represents the upper boundary of the short-term trading range and should be considered a key turning point. Some follow-through selling that led to a subsequent break below the psychological level of 155.00 could shift the near-term bias towards a bearish USD/JPY. On the other hand, a sustained strong rally above 156.00 could push the spot price to the 156.60-156.65 area, and then closer to the vicinity of 157.00, or the two-week high reached on Tuesday. Some follow-through buying should pave the way for further gains. USD/JPY may subsequently break through the intermediate resistance at 157.45 and target a challenge of the multi-month high near 158.00, a level reached in November.
Consider shorting the dollar near 155.75 today; Stop loss: 156.00; Target: 154.80; 154.60
EUR/USD
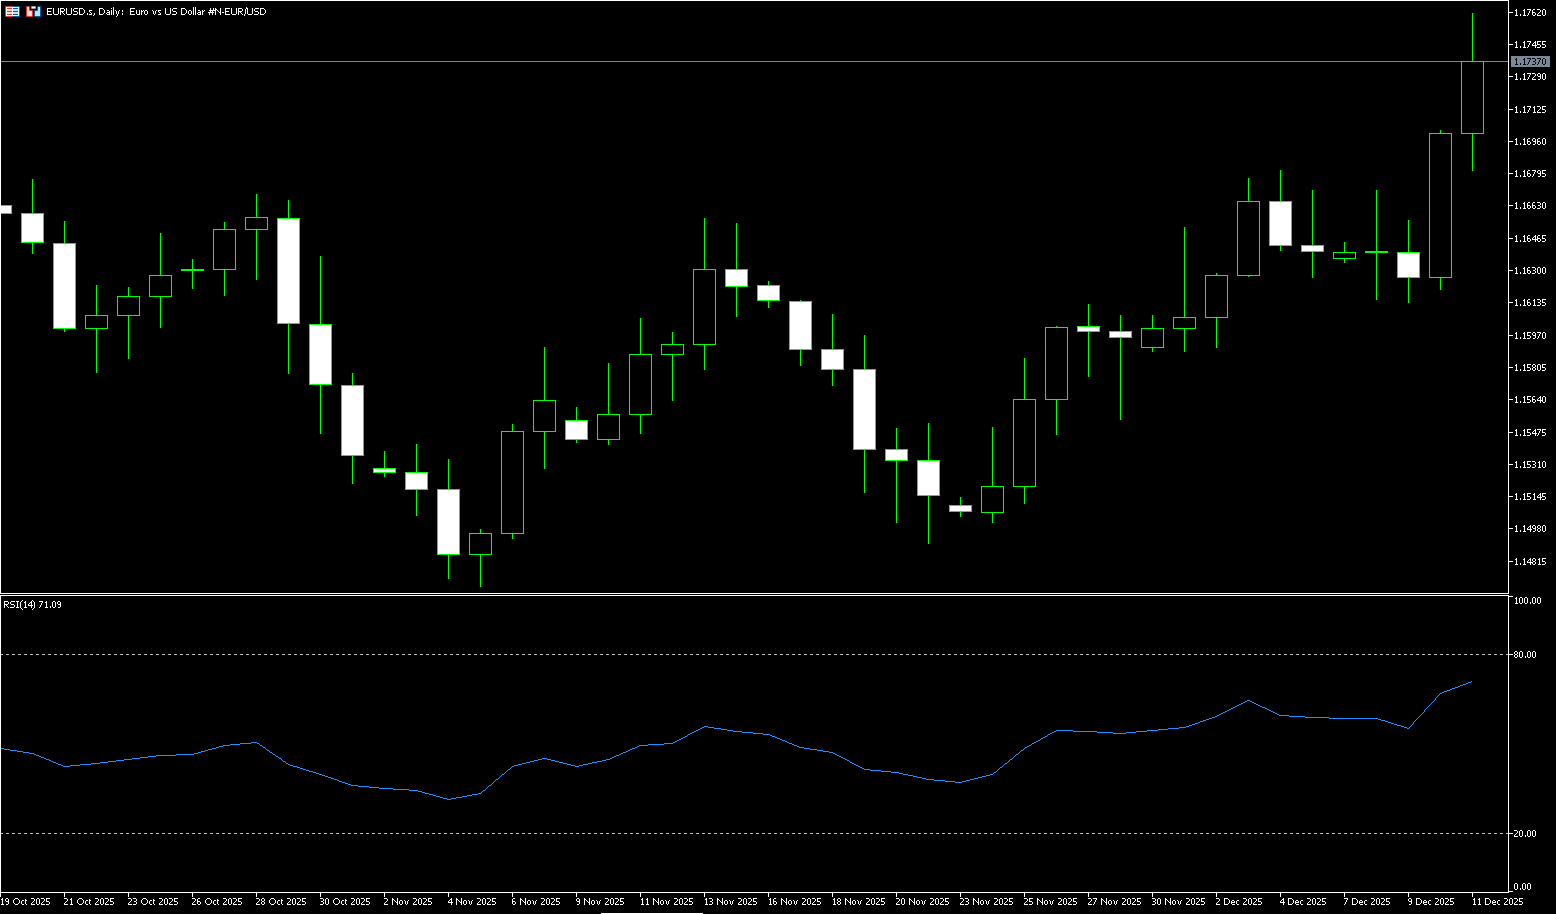
The euro continued to rise against the dollar on Thursday as the dollar fell to a multi-week low following the release of the latest US initial jobless claims data. The euro/dollar exchange rate was around 1.1762, its highest level since October 3. Previously released US data showed that initial jobless claims rose to 236,000 in the week ending December 6, exceeding the expected 220,000 and significantly higher than the revised 192,000 of the previous week. The four-week moving average also rose slightly to 216,750, while continuing jobless claims fell to 1.838 million in the week ending November 29. The latest jobless claims data added to signs of a cooling labor market, consistent with the assessment in the Federal Reserve's monetary policy statement on Wednesday. Policymakers emphasized rising downside risks to employment, a key factor in their decision to cut interest rates by another 25 basis points.
The euro/dollar pair became positive after breaking through resistance in the 1.1680 area. The 4-hour MACD is showing a green histogram, indicating strong bullish momentum, while the 4-hour RSI is in positive territory but still below overbought levels. In this context, further appreciation is possible given the weakness of the dollar index. Immediate resistance is at the intraday high of 1.1762, followed by the October 1 high around 1.1778, and then 1.1800 (a psychological level). On the downside, support is provided by the December 4 high near 1.1680, followed by the December 9 low at 1.1615, and then the lows of December 1 and 2 around 1.1590.
Consider going long on the Euro today around 1.1730; Stop loss: 1.1720; Target: 1.178; 1.1790
Disclaimer: The information contained herein (1) is proprietary to BCR and/or its content providers; (2) may not be copied or distributed; (3) is not warranted to be accurate, complete or timely; and, (4) does not constitute advice or a recommendation by BCR or its content providers in respect of the investment in financial instruments. Neither BCR or its content providers are responsible for any damages or losses arising from any use of this information. Past performance is no guarantee of future results.
Lebih Liputan


Pendedahan Risiko:Instrumen derivatif diniagakan di luar bursa dengan margin, yang bermakna ia membawa tahap risiko yang tinggi dan terdapat kemungkinan anda boleh kehilangan seluruh pelaburan anda. Produk-produk ini tidak sesuai untuk semua pelabur. Pastikan anda memahami sepenuhnya risiko dan pertimbangkan dengan teliti keadaan kewangan dan pengalaman dagangan anda sebelum berdagang. Cari nasihat kewangan bebas jika perlu sebelum membuka akaun dengan BCR.
BCR Co Pty Ltd (No. Syarikat 1975046) ialah syarikat yang diperbadankan di bawah undang-undang British Virgin Islands, dengan pejabat berdaftar di Trident Chambers, Wickham’s Cay 1, Road Town, Tortola, British Virgin Islands, dan dilesenkan serta dikawal selia oleh Suruhanjaya Perkhidmatan Kewangan British Virgin Islands di bawah Lesen No. SIBA/L/19/1122.
Open Bridge Limited (No. Syarikat 16701394) ialah syarikat yang diperbadankan di bawah Akta Syarikat 2006 dan berdaftar di England dan Wales, dengan alamat berdaftar di Kemp House, 160 City Road, London, City Road, London, England, EC1V 2NX. Entiti ini bertindak semata-mata sebagai pemproses pembayaran dan tidak menyediakan sebarang perkhidmatan perdagangan atau pelaburan.

 English
 简体中文
简体中文
 繁體中文
繁體中文
 Bahasa
Melayu
Bahasa
Melayu
 Tiếng
Việt
Tiếng
Việt
 ไทย
ไทย
 日本語
日本語
 한국어
한국어
 ភាសាខ្មែរ
 español