


0
US Dollar Index
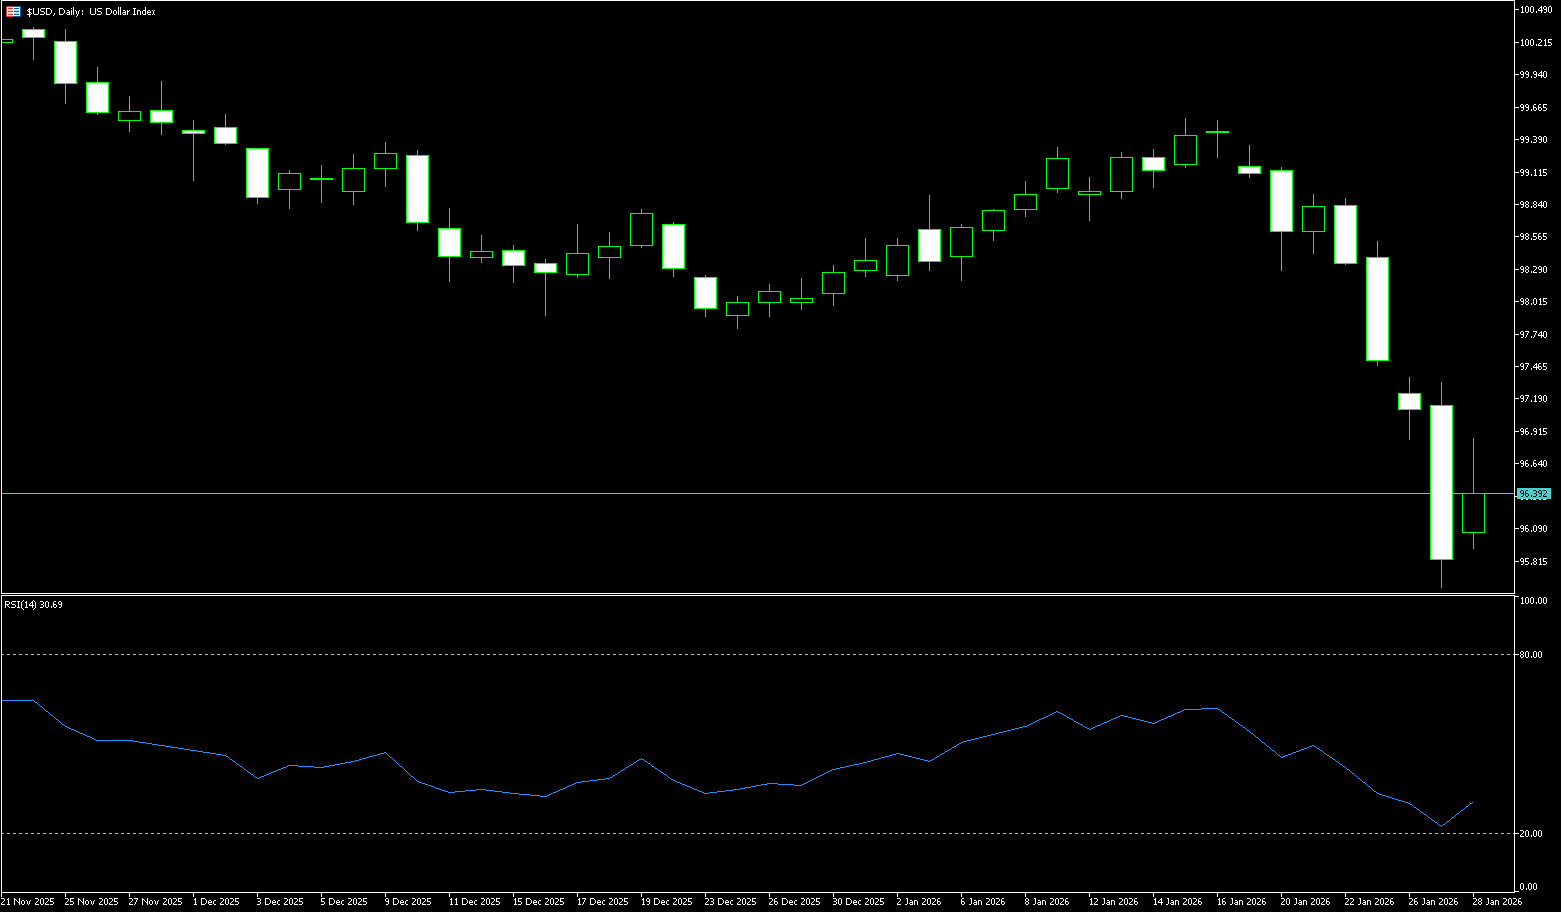
Anyone expecting a calm start to 2026 for the dollar will be surprised. The dollar is heading for its third consecutive monthly decline, with a high-to-low range of nearly 4%—the most volatile month in the past six months. The dollar index rebounded on Wednesday after a significant decline over the previous four trading days, briefly touching a four-year low of 95.57, and is currently trading near 96.00. However, this short-term technical pullback does not change the overall bearish bias. Meanwhile, the Federal Reserve, as expected, kept the federal funds rate unchanged, pausing after three consecutive rate cuts last year. The Fed also slightly raised its assessment of economic growth, reinforcing market expectations that the next rate cut may come in June. The dollar's decline did not come without warning; market positioning had already given early warnings. Since peaking in 2014, net long positions have been declining steadily, mainly due to a steady decrease in total long positions. Traders have been net short for several weeks, but sentiment has not yet reached an extreme, while total short positions continue to accumulate.
Given the recent rise in bearish volatility, the US dollar index may fall towards the 90 level. The daily chart shows that when bearish volatility has reached similar highs in the past, the market has often formed a temporary low before continuing its decline. Tuesday's low fell precisely between the 138.2% (95.95) and 161.8% (94.80) Fibonacci extension levels, confirming the risk of short-term two-way volatility. Even so, any rebound may still be seen as a selling opportunity. Short sellers are expected to position themselves on rallies, ultimately pushing the dollar index below the 90 support level. Therefore, the short-term resistance area is at 96.56 (the low of September 16th last year) and 97.00 (the psychological level). On the downside, watch the 95.56 (Tuesday's low) and 95.00 (the psychological level).
Today, consider shorting the US Dollar Index around 96.48; Stop loss: 96.60; Target: 96.00; 95.90
WTI Crude Oil
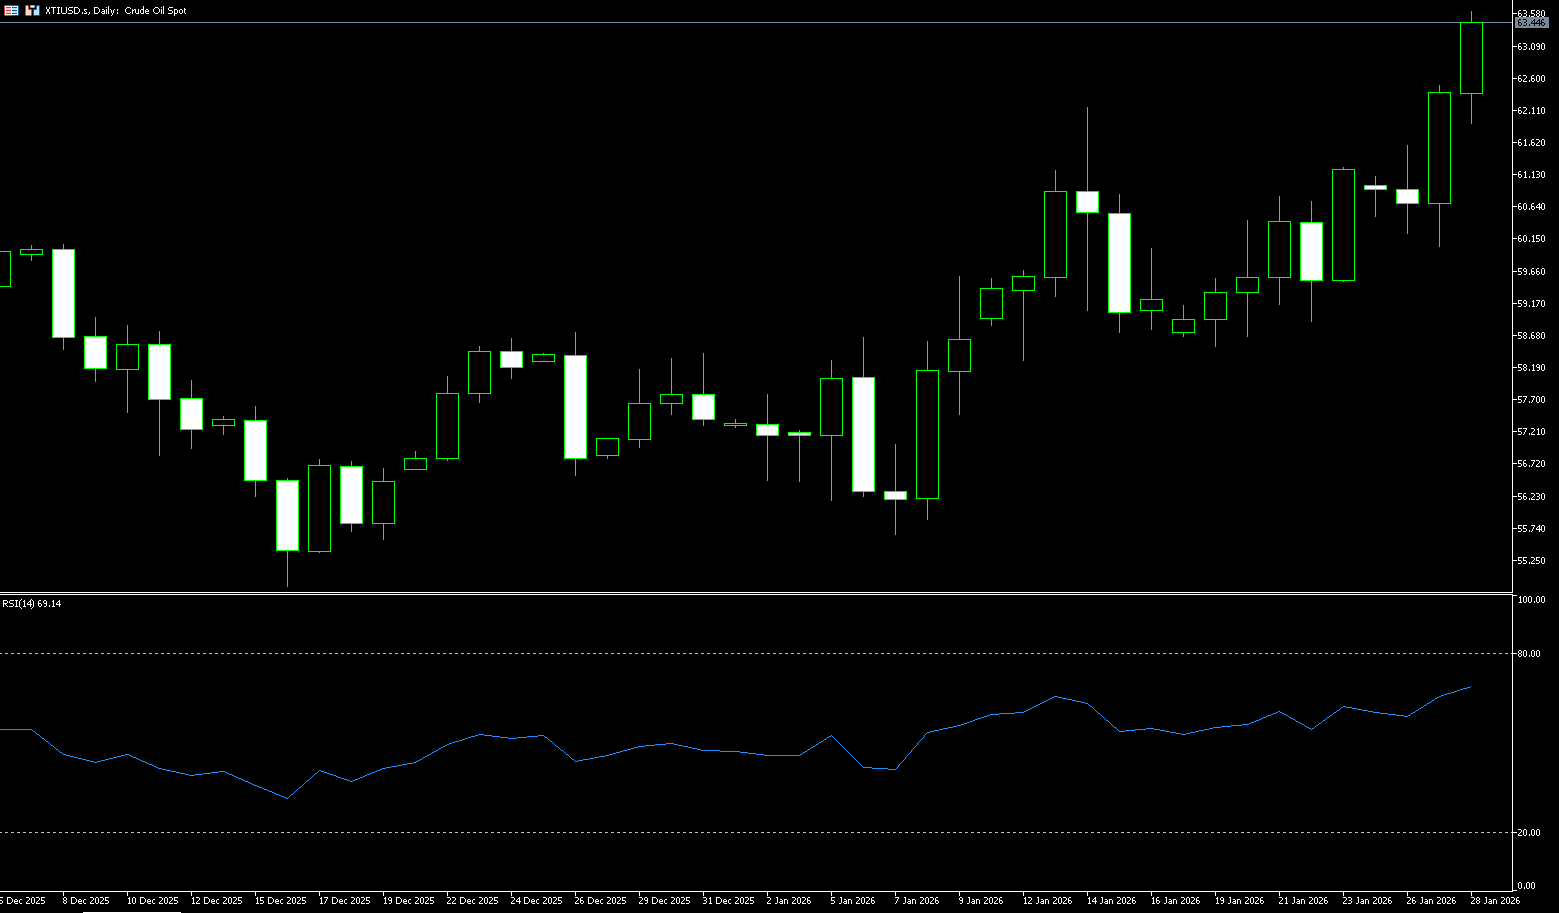
US WTI crude oil is trading around $63.30 per barrel. Oil prices rose nearly 3% on Tuesday, impacted by winter storms and continued disruptions to US oil production and Middle East tensions. The current WTI crude oil market exhibits a typical tug-of-war between "news-driven" and "structural suppression." On one hand, the recovery of production at Kazakhstan's largest oil field and an unexpected accumulation of US crude oil and refined product inventories have strengthened expectations of ample supply. On the other hand, winter storms hitting US production areas have caused short-term damage to production and refining capacity, coupled with geopolitical tensions in the Middle East, providing bottom support for prices. This immediate hedging of bullish and bearish factors has resulted in prices oscillating within a narrow range. Meanwhile, geopolitical risks persist, with a US Navy carrier strike group arriving in the Middle East, exacerbating market concerns about potential supply disruptions.
Technical analysis indicates that WTI crude oil remains in a short-term consolidation range. The current price is around $63.00, slightly above the psychological level of $60.00, indicating that the bulls have not yet broken through the long-term key resistance level. Looking at recent price action, although there has been a rebound, it has failed to effectively break through $63.50, indicating significant selling pressure above. In terms of indicators, the MACD shows that bullish momentum has strengthened, but whether this strength can be sustained remains to be seen. The RSI is around 61, in a neutral-to-bullish range, not yet in overbought territory, suggesting some upward momentum in the short term. On the downside, the 150-day simple moving average at $61.42 coincides with the support level, followed by $60.00 (the psychological level), which serves as a crucial short-term support line. Upside targets are the $64.00 (a psychological level) and the $64.49 (the 300-day moving average) level.
Today, consider going long on crude oil around 63.15; Stop loss: 63.00; Target: 6450; 65.00
Spot Gold
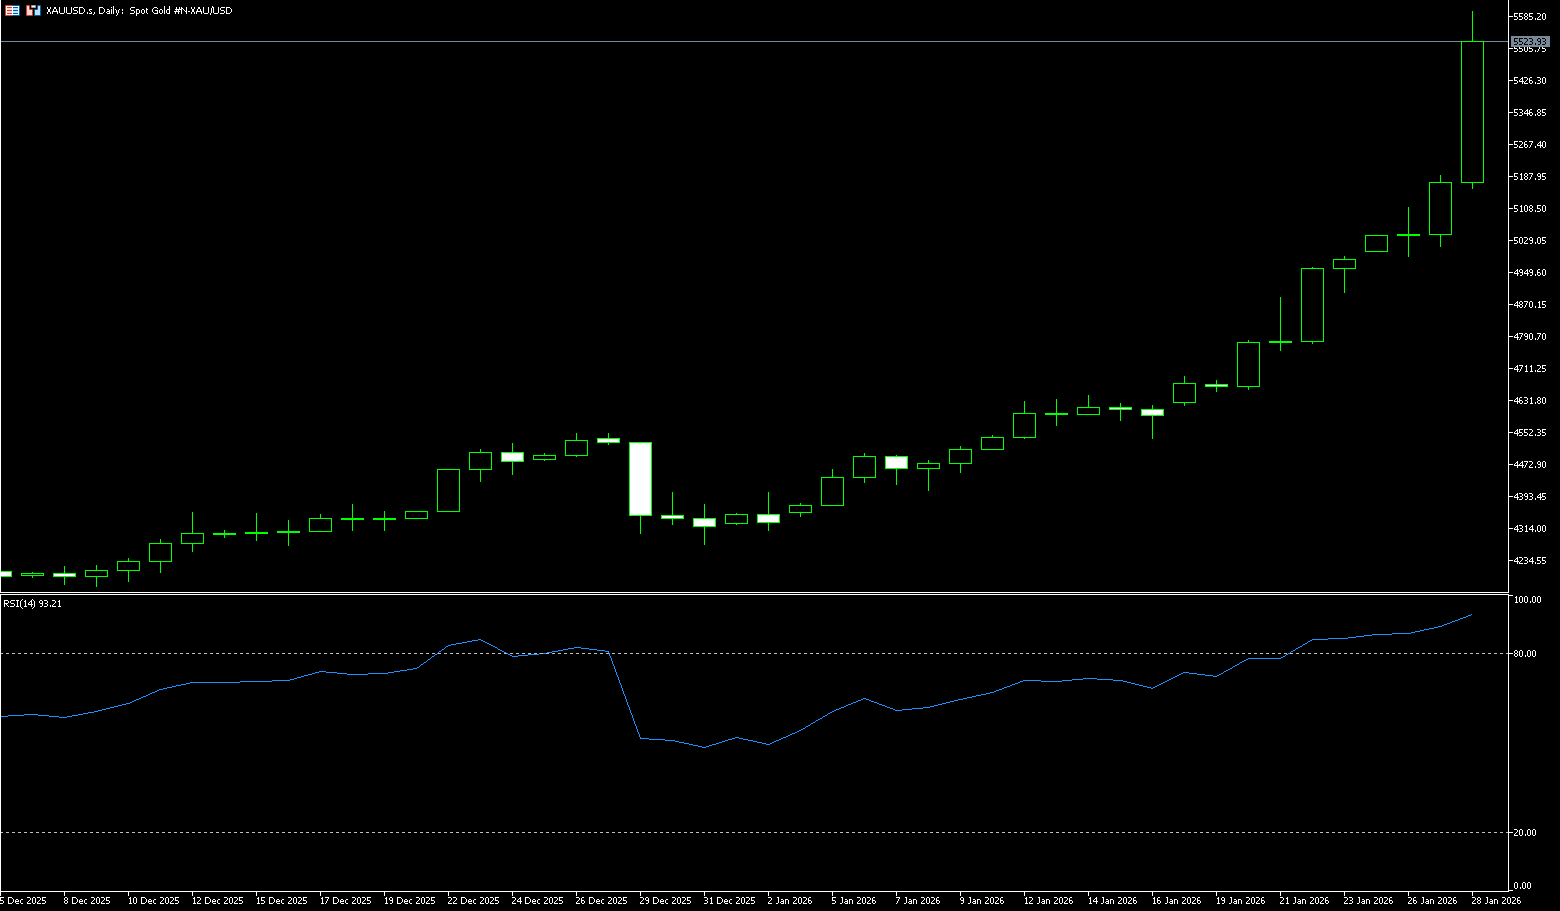
Gold prices surged during North American trading hours as the Federal Reserve kept interest rates unchanged as expected, though not unanimously, with two dissenting voices voting in favor of a rate cut. Meanwhile, Fed Chairman Jerome Powell maintained a neutral stance, keeping the status quo in place. At the time of writing, gold prices had risen more than 4% after reaching a record high of $5,414. The dollar fell to its lowest level in four years, indicating government satisfaction with a weaker dollar to support export competitiveness. Policy uncertainty in Washington, including Trump's tariff threats against other countries and attacks on the Fed's independence, further supported the rise in precious metals. Meanwhile, the market widely expects the Fed to keep rates unchanged on Wednesday, and is focused on any guidance regarding the timing of the next rate cut. Gold also benefited from strong central bank purchases and continued ETF inflows. Year-to-date, gold prices have risen about 20%, while silver prices have risen nearly 60%.
Since gold prices gapped up to $4,642.90 on January 19th, traders have consistently adopted a buy-on-dips strategy. Monday's price action signaled the first sign of weakening momentum in six trading days. A break below $5,111.50 would be another signal of a momentum reversal; the 14-day Relative Strength Index (RSI) is at 89, and a break below $4,990.20 (Tuesday's paper price) - $5,000.00 (a psychological level) would confirm a formal shift in momentum. A price above $5,300 would re-establish the existing upward trend; the next target is $5,450, followed by $5,500.
Consider going long on gold around 5.410 today; Stop loss: 5.405; Target: 5.450; 5.460
AUD/USD
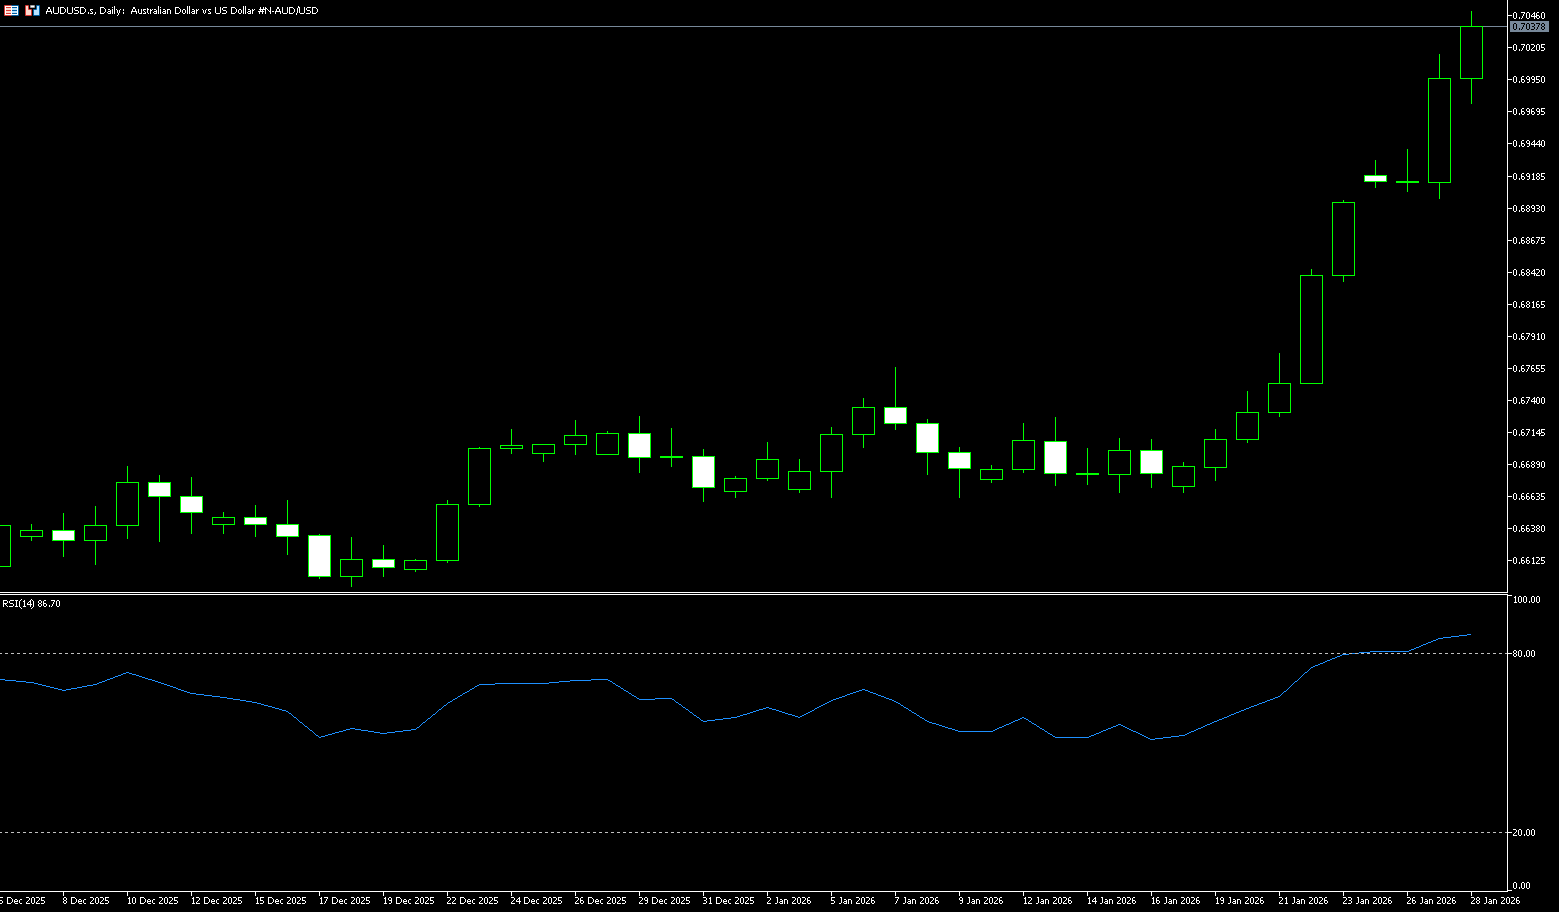
The AUD/USD pair rose further, breaking through the key 0.7000 barrier. The pair's strong gains are in response to the continued sharp decline in the US dollar amid a generally risk-on sentiment. Looking ahead, domestic investors are expected to closely watch Australian inflation data released on Wednesday. Supported by attractive high yields, Australian government bond yields have become increasingly attractive, with policy-sensitive three-year bonds climbing to their highest level since November 2023, reflecting investor confidence in Australia's top credit rating and the central bank's hawkish policy outlook. Domestic economic data further strengthened the case for interest rate hikes, as the unemployment rate unexpectedly fell to a seven-month low in December. The focus now shifts to the key inflation data due on Wednesday, with investors closely watching the December monthly consumer price index and the revised fourth-quarter mean index, the latter widely regarded as a measure of underlying price pressures favored by the Reserve Bank of Australia.
The bullish trend in AUD/USD currently appears unstoppable. Meanwhile, momentum indicators appear bullish, but caution is warranted: the 14-day Relative Strength Index (RSI) remains in clearly overbought territory near 84, while the Average Directional Index (ADX) above 40 suggests a strong trend. However, as the pair moves further into overbought territory, the idea of a technical correction is expected to gain attention. The next target is the 0.7080 level, and after breaking this level, the next relevant resistance is at the week's high of 0.7157 (February 2nd). Regarding the possibility of a correction, the current low of 0.6901 (Tuesday's low) has become a direct target. From there, the next support level is 0.6800 (a psychological level).
Consider going long on the Australian dollar around 0.7025 today; Stop loss: 0.7010; Target: 0.7070; 0.7080
GBP/USD
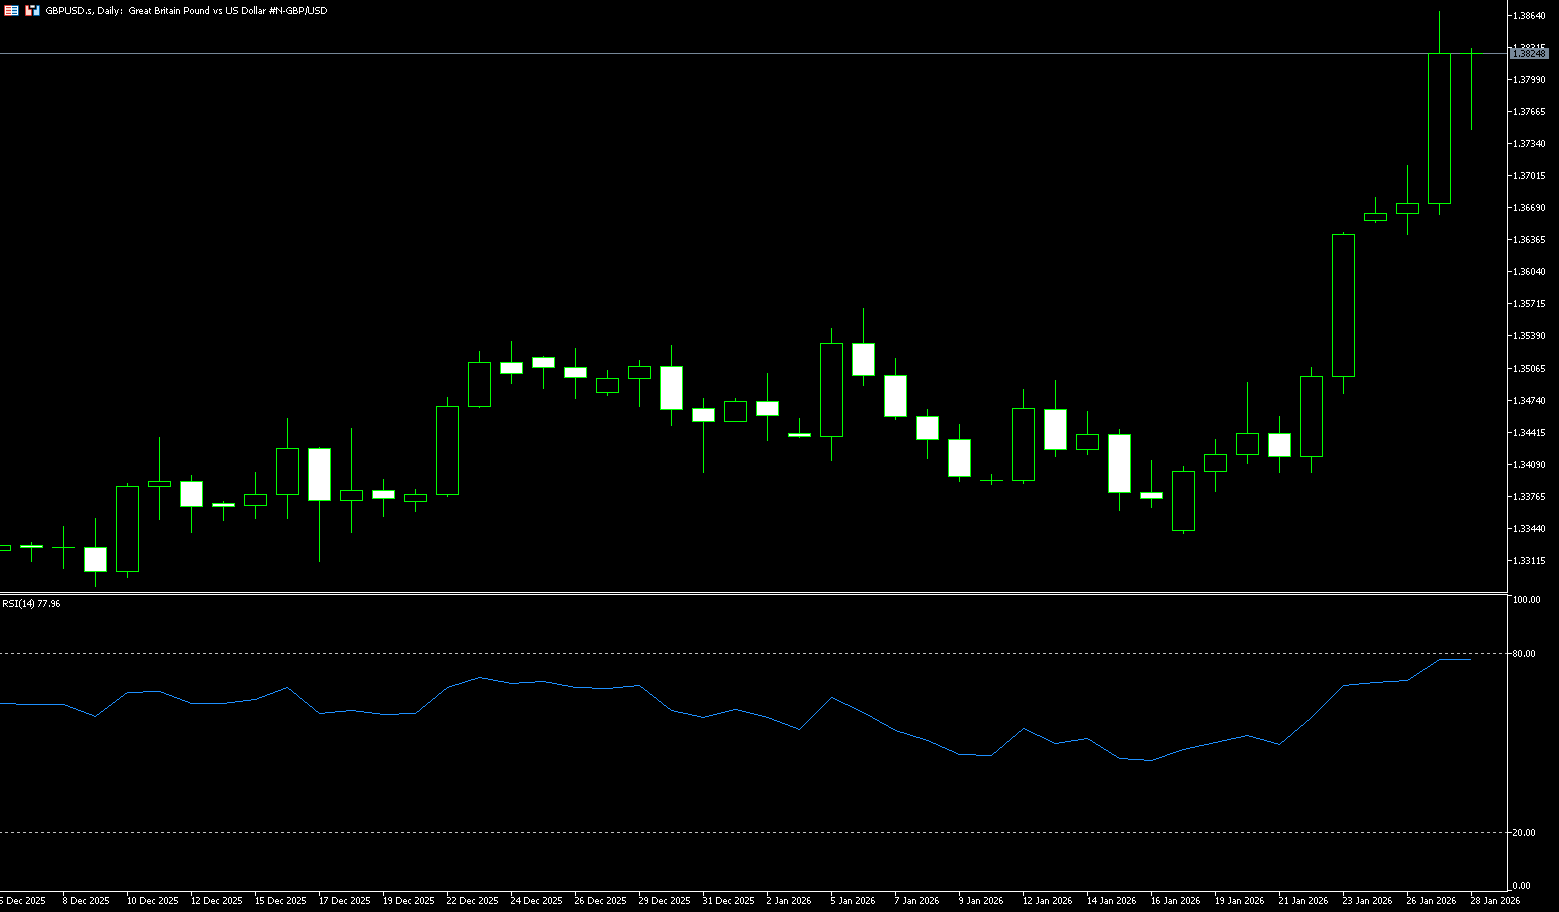
GBP/USD is making steady progress on its second consecutive week of strong gains as the dollar loses its edge amid ongoing trade war rhetoric. The pound is on track for its third consecutive monthly gain, having reached multi-year highs as its rally continues to accelerate. Investors will focus on the Federal Reserve's forward guidance, particularly signals regarding the timing of potential rate cuts. The futures market currently anticipates two 25-basis-point rate cuts by the end of 2026. US President Donald Trump's recent announcement of further deliberate trade friction has not benefited the dollar. Trump's latest round of tariff threats against major EU member states and the UK over Greenland ownership have largely failed to gain traction. Despite Trump's vague claim that "things are progressing in Greenland," there appears to be no evidence that European countries are currently prepared to abandon retaliatory tariffs if necessary.
The pound surged in the first half of last week while the dollar continued to weaken. Currently, GBP/USD is testing its highest buying interest in 51 months, trading at 1.3820, after previously touching a four-year high of 1.3856. The price is testing this dynamic upper limit. Furthermore, the pair has broken through a key technical level that has hindered a mid-2025 bull market for the pound. A close above this level would improve short-term momentum. Initial resistance is seen in the 1.3900 (psychological level) – 1.3913 (September 2021 high) range. Failure to break this area could lead to a retest of the 1.3957 (August 2021 high) range. However, 1.4000 remains a key technical hurdle for a continuation of the bullish trend. Support lies near the 1.3800 level; a break below this level could trigger a more significant pullback to 1.3713 (Monday's low).
Consider going long on GBP/USD around 1.3790 today; Stop loss: 1.3780; Target: 1.3850, 1.3860
USD/JPY
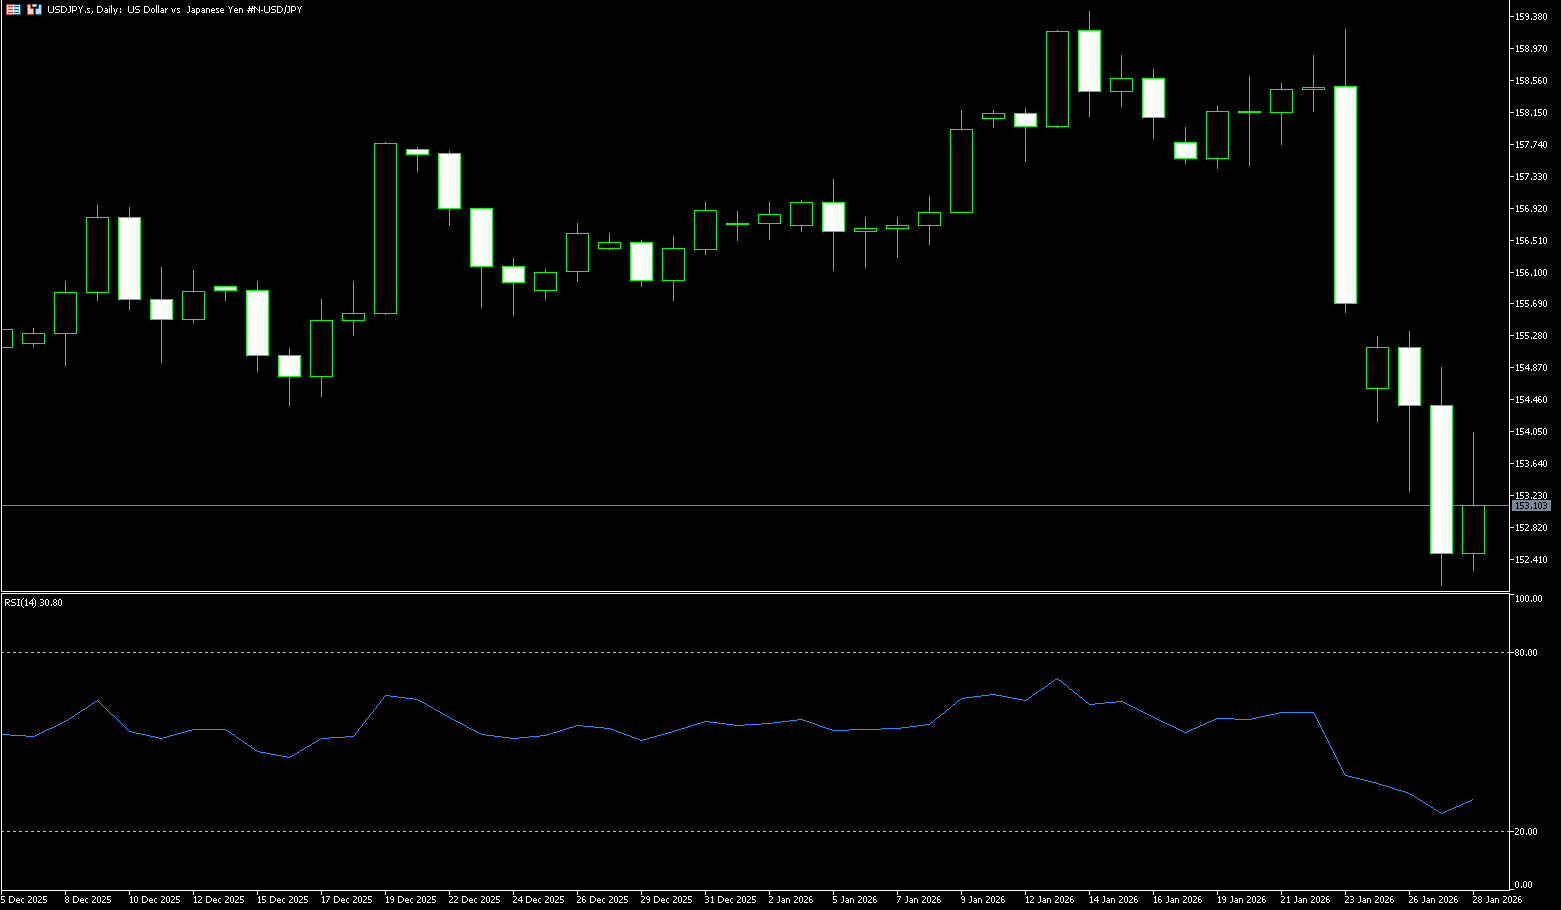
The yen traded near $152.55 on Wednesday, close to a three-month high, after rising nearly 4% over the past three trading days, fueled by heightened speculation of coordinated foreign exchange market intervention between Tokyo and Washington. This move followed a report from the New York Federal Reserve Bank on Friday regarding a USD/JPY rate check with market traders, and further, Japanese officials indicated close coordination with the US on monetary policy and potential market actions. Traders remain cautious about the risk of unilateral intervention from Tokyo, although data from the Bank of Japan suggests that authorities have not yet formally entered the market. The yen received further support from broad dollar weakness as US President Trump stated he was not worried about the recent dollar decline and noted that the dollar had not fallen much.
From a technical perspective, the overnight break below the 100-day simple moving average of 153.85 and a close below 154.00 is considered a new trigger for a USD/JPY downtrend. Spot prices remain below the aforementioned support level, and despite the overall upward trend, short-term movement remains heavy. The MACD (Moving Average Convergence/Divergence) line is below the signal line and below zero, with the widening negative histogram further reinforcing bearish momentum. The 14-day Relative Strength Index (RSI) is at 28.65 (oversold), which may allow for a pause or correction in the rally. The 38.2% Fibonacci retracement level from the low of 140.12 to the high of 159.19 provides initial support at 151.91; a further break below this level would extend the decline. A rise in the RSI above 30 would confirm stabilizing momentum. Reclaiming the psychological level of 153.85-154.00, above the rising 100-day simple moving average, would alleviate pressure and refocus attention on the 155.30 (6-day moving average) level.
Today, consider shorting the US dollar around 153.65; Stop loss: 154.80; Target: 152.80; 152.70
EUR/USD
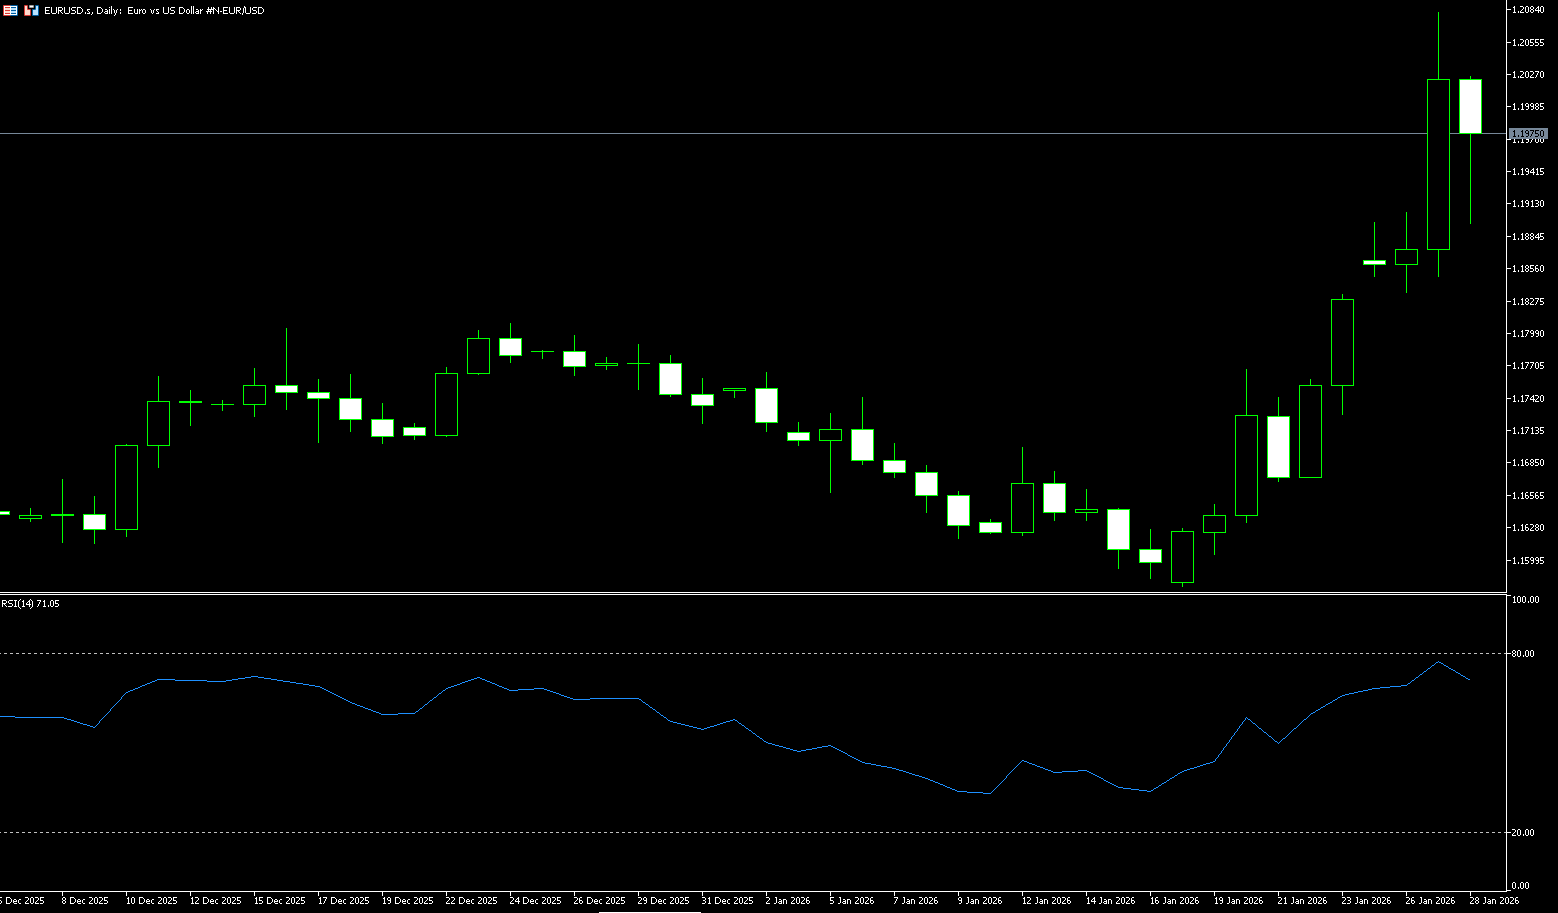
The euro/dollar pair surged to a five-year high of 1.2082 after US President Trump stated he didn't think the dollar had fallen much, triggering a sell-off. The dollar has fallen more than 1.31% so far today. Currently, the pair is trading slightly below 1.2000. Trump showed no concern about the dollar, adding, "The dollar is finding its own level, which is fair." He also stated that the dollar might "go up and down like a yo-yo." The dollar index fell 1.30% to 95.79, slightly above the four-year low reached when Trump made his comments. US economic data showed that consumer confidence deteriorated, according to the Conference Board report. Earlier, the four-week moving average of ADP employment change showed signs of weakness, falling from 8,000 to 7,750. Across the Atlantic, European Central Bank policymakers spoke out. Joachim Nagel of the Bundesbank stated that there is no reason to change interest rates in any direction. Martin Kocher of the European Central Bank echoed this sentiment.
The upward trend in EUR/USD remained intact following Trump's comments. The divergence between the Federal Reserve and the ECB could narrow interest rate differentials and increase the prospect of a common currency. If EUR/USD breaks above 1.2100, the next resistance levels will be 1.2150 and 1.2200. Notably, the Relative Strength Index (RSI) was at a high of 73.90, near the extreme high of July 30, 2020. If the pair falls below 1.2000, the first support level will be 1.1950, followed by last year's high of 1.1918, and then the psychological level of 1.1900. In the event of further weakness, the next support level will be the January 26 low of 1.1834.
Consider going long on the Euro today around 1.1945; Stop loss: 1.1930; Targets: 1.2000, 1.2010
Disclaimer: The information contained herein (1) is proprietary to BCR and/or its content providers; (2) may not be copied or distributed; (3) is not warranted to be accurate, complete or timely; and, (4) does not constitute advice or a recommendation by BCR or its content providers in respect of the investment in financial instruments. Neither BCR or its content providers are responsible for any damages or losses arising from any use of this information. Past performance is no guarantee of future results.
Lebih Liputan


Pendedahan Risiko:Instrumen derivatif diniagakan di luar bursa dengan margin, yang bermakna ia membawa tahap risiko yang tinggi dan terdapat kemungkinan anda boleh kehilangan seluruh pelaburan anda. Produk-produk ini tidak sesuai untuk semua pelabur. Pastikan anda memahami sepenuhnya risiko dan pertimbangkan dengan teliti keadaan kewangan dan pengalaman dagangan anda sebelum berdagang. Cari nasihat kewangan bebas jika perlu sebelum membuka akaun dengan BCR.
BCR Co Pty Ltd (No. Syarikat 1975046) ialah syarikat yang diperbadankan di bawah undang-undang British Virgin Islands, dengan pejabat berdaftar di Trident Chambers, Wickham’s Cay 1, Road Town, Tortola, British Virgin Islands, dan dilesenkan serta dikawal selia oleh Suruhanjaya Perkhidmatan Kewangan British Virgin Islands di bawah Lesen No. SIBA/L/19/1122.
Open Bridge Limited (No. Syarikat 16701394) ialah syarikat yang diperbadankan di bawah Akta Syarikat 2006 dan berdaftar di England dan Wales, dengan alamat berdaftar di Kemp House, 160 City Road, London, City Road, London, England, EC1V 2NX. Entiti ini bertindak semata-mata sebagai pemproses pembayaran dan tidak menyediakan sebarang perkhidmatan perdagangan atau pelaburan.

 English
 简体中文
简体中文
 繁體中文
繁體中文
 Bahasa
Melayu
Bahasa
Melayu
 Tiếng
Việt
Tiếng
Việt
 ไทย
ไทย
 日本語
日本語
 한국어
한국어
 ភាសាខ្មែរ
 español