


0
US Dollar Index
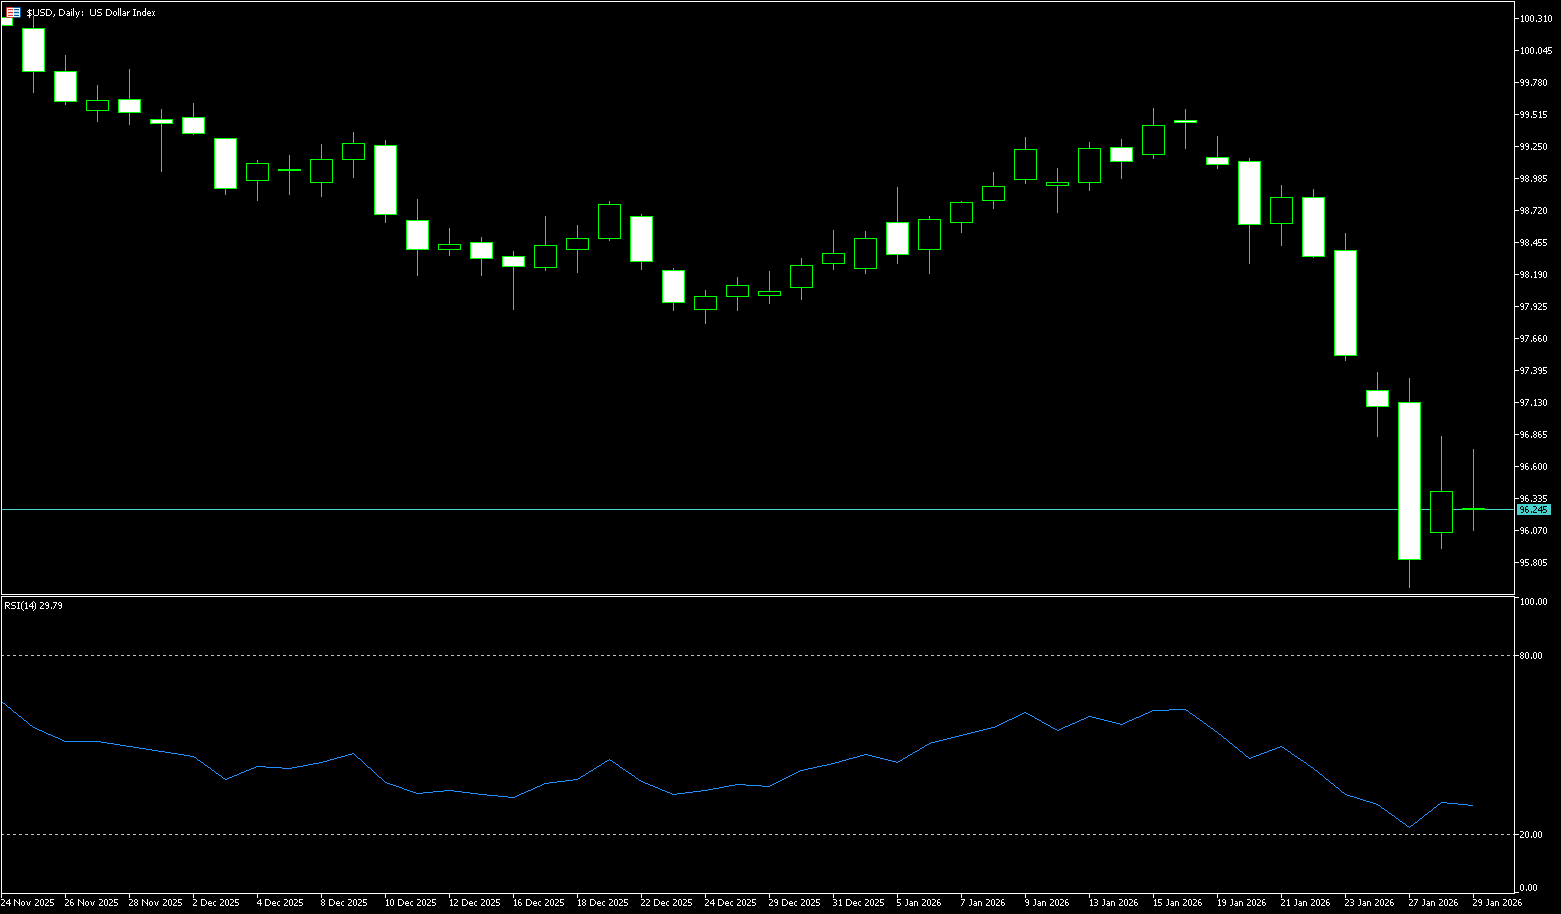
The US dollar index fell on Thursday, hovering around 96, erasing gains from the previous session, as Treasury Secretary Scott Bessant reiterated that the boost from a strong dollar policy was short-lived. Bessant dismissed speculation about US intervention to sell the dollar against the yen, contrasting with President Donald Trump's comments that the government was satisfied with the dollar's weakness. Continued inflows into physical assets also put pressure on currencies, with gold, silver, and copper prices hitting new highs. Geopolitical and trade risks, along with policy uncertainty in Washington, eroded confidence in the global reserve currency. Meanwhile, the Federal Reserve kept interest rates unchanged as expected, and Chairman Jerome Powell hinted that central banks might remain on the sidelines for some time. The Fed noted that economic activity continued to expand at a solid pace, the unemployment rate showed signs of stabilizing, and inflation remained slightly high.
In summary, the current decline in the US dollar index is a result of a combination of technical breakdowns and deep-seated fundamental headwinds. From a technical chart perspective, the US dollar index's downward break is supported by clear signals. The daily chart shows that the dollar index previously oscillated within a large range of 96.50–100.40. Recent price weakness has effectively broken below the support near 97.00 and touched the previous key level of 96.58. This means the lower edge of the months-long trading range has been breached. The MACD indicator shows a typical bearish pattern, indicating increasing downward momentum. The short-term trend is clearly weak. The primary support level to watch in the near term is the 96.00-95.58 area. This area was a significant trading platform in the third quarter of last year; a decisive break below it could open the door for the dollar index to test 95.00 or even lower levels. The first strong resistance level for any recent rebound is at 97.30-97.50 (the former lower Bollinger Band and previous low), with a more significant resistance at 98.00 (a psychological level). Any rebound must first hold above 97.50 to alleviate the current downward pressure.
Consider shorting the US Dollar Index around 96.33 today; Stop Loss: 96.45; Target: 96.00; 95.90
WTI Crude Oil
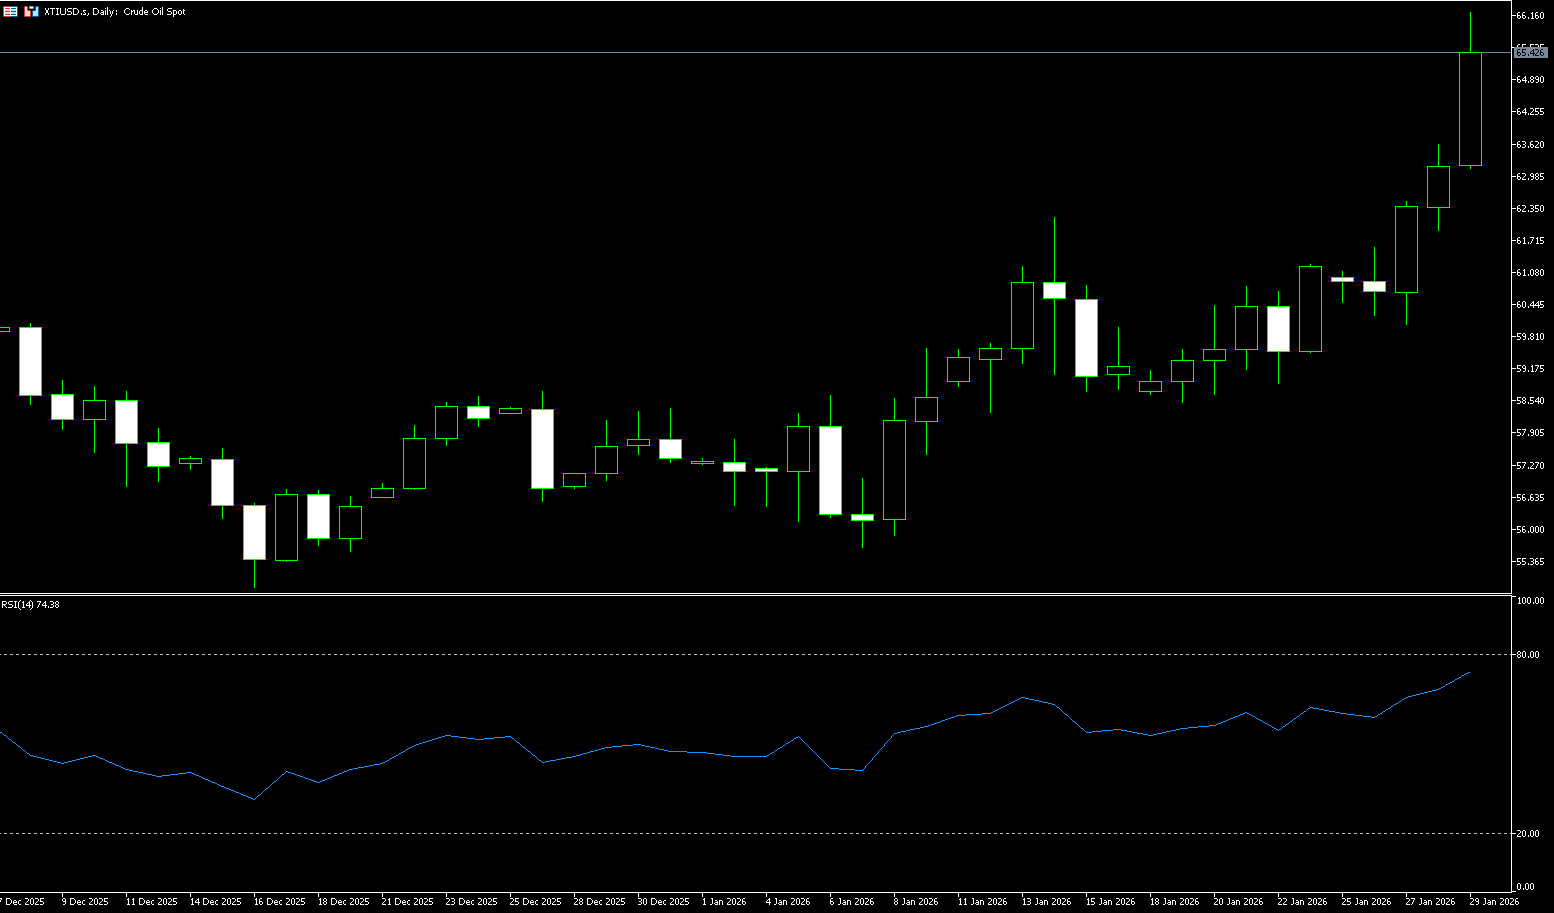
WTI crude oil futures rose more than 3.5% to around $65.10 a barrel, the highest intraday level since September and nearing the strongest closing price since August, as renewed US threats against Iran led to a rise in geopolitical risk premiums. President Donald Trump warned Tehran to agree to a nuclear deal or face military strikes, stating that US naval forces in the region are ready to act if necessary. The prospect of a US strike has raised concerns about potential disruptions to Middle Eastern oil flows, which account for about one-third of global supply, and any Iranian retaliation could threaten shipping through the Strait of Hormuz, a vital passage for oil and liquefied natural gas cargoes. Despite anticipated oversupply, oil prices have already risen this year, supported by geopolitical tensions related to Iran and Venezuela, as well as supply disruptions in Kazakhstan; Trump's latest comments further amplified the upside risks.
For crude oil, the strong rebound of the US dollar is undoubtedly a direct negative factor. As a core global commodity priced in US dollars, the negative correlation between crude oil and the US dollar index was fully demonstrated today. Considering the current market situation, the core target price range for WTI crude oil in the short term has been revised down to $63.50-$65.50. This adjustment does not negate the upward trend of oil prices, but rather represents a rational adjustment after the struggle between bullish and bearish forces. From a technical perspective, although WTI crude oil broke through the psychological resistance level of $62.00 and stabilized above the 200-day moving average at $61.92 (forming solid support), profit-taking triggered by the dollar's rebound has led to a "high-low" doji pattern on the daily chart, suggesting that the short-term bullish momentum has been somewhat exhausted. If the dollar's strength continues, oil prices will likely rebound to the range of $65.00 (the psychological level) and $67.06 (the high point of last August), fluctuating repeatedly, and it will be difficult to quickly break through the previous high. On the downside support level, Thursday's low of $63.12 coincides with the support level, followed by $61.93 (the 200-day moving average), which serves as a crucial short-term support line.
Today, consider going long on crude oil around $64.85; Stop loss: $64.70; Target: $66.20; $66.50
Spot Gold
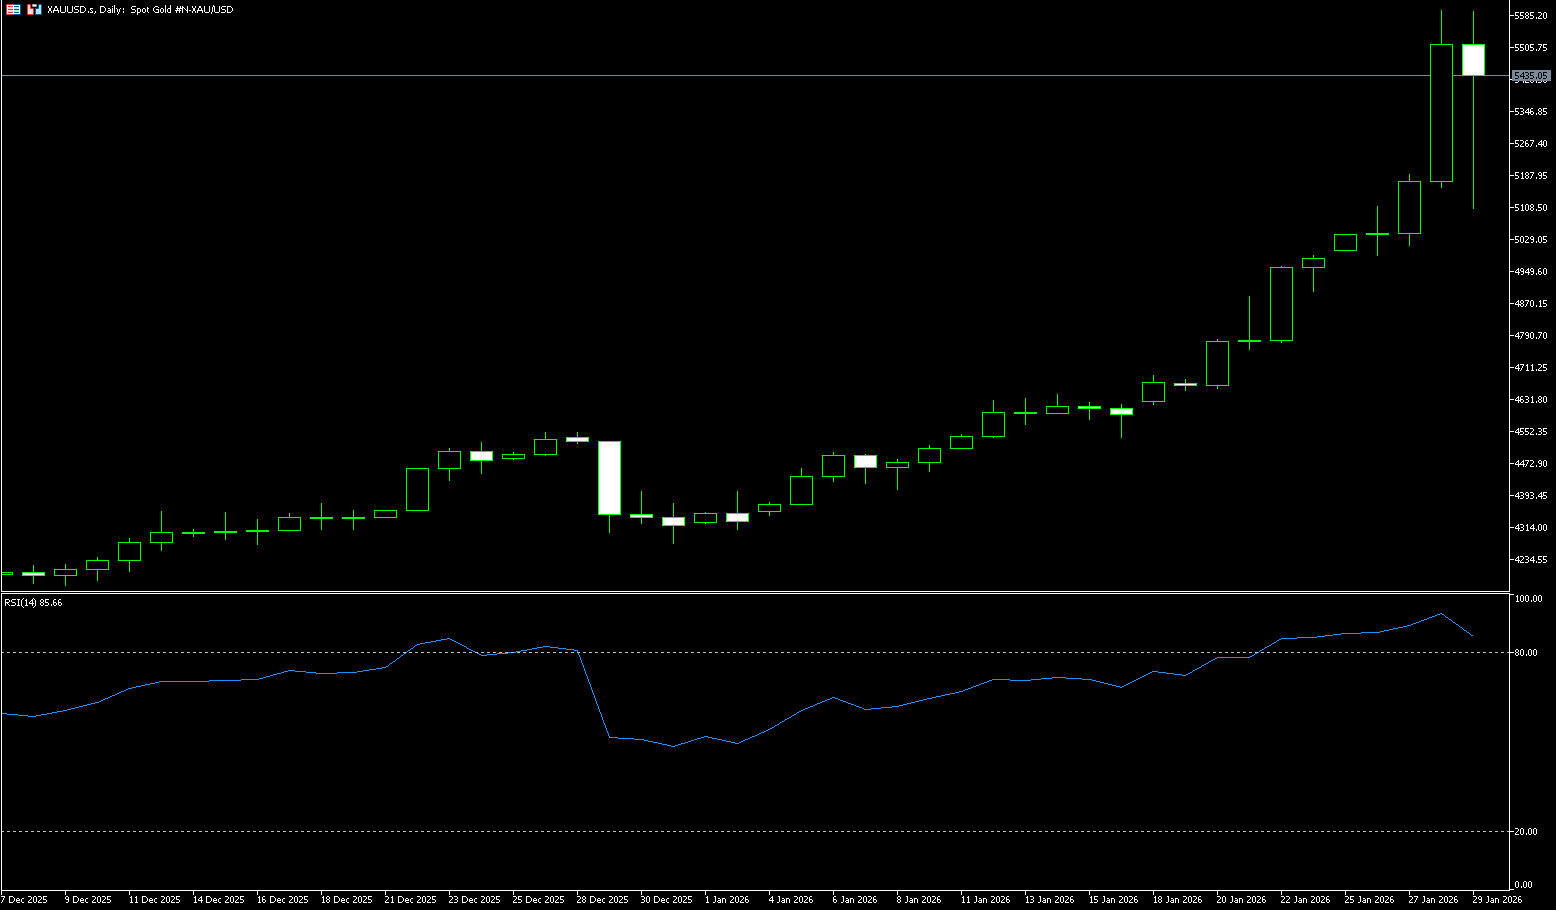
On Thursday morning, spot gold continued to refresh its historical highs, currently testing the $5.598/ounce mark. This round of gains is mainly driven by continued economic and geopolitical uncertainties, with investors flocking to safe-haven assets. The market reacted mildly to the Fed's interest rate decision, and analysts pointed out that the strong buying in precious metals seems to have entered a "self-driven phase." Looking back at history, the end of two landmark gold bull markets was highly correlated with a trend of rising real interest rates. Looking back at the gold market over the past half-century, no bull market ending has been triggered by a single event or indicator; all trend reversals are the result of multiple macroeconomic variables, demand structures, and market sentiment changes converging and resonating within the same timeframe. The trend of rising real interest rates, weakening marginal drivers of core demand, the shift of the upward logic from macroeconomic fundamentals to pure risk aversion, the return of the negative correlation between the US dollar and gold, and the shift in market participant structure towards short-termism—these signals, when appearing individually, are insufficient to reverse the bullish trend in gold. The market often ignores a single signal and continues its existing trend.
Gold prices continued their rise, hitting new highs for six consecutive days in a parabolic pattern, pushing gold from approximately $4,600 to a new high of $5,598. To date, gold has risen by over 30%. A break above the historical high will expose the $5,600 level. On the daily chart, gold prices are extremely overbought, with the 14-day Relative Strength Index (RSI) at 89 but showing no signs of directional change. Technical indicators continue to rise, well into positive territory, and the pair's gains have exceeded all moving averages. The 20-day simple moving average has risen above the 100-day and 200-day simple moving averages, highlighting strong bullish momentum. Buyers may be targeting $5,600. A break above this level would test $5,700. Conversely, if gold prices fall below $5,300, the first support level will be $5,250, followed by $5,200.
Consider going long on gold today around 5.390; Stop loss: 5.380; Target: 5,450; 5,460
AUD/USD
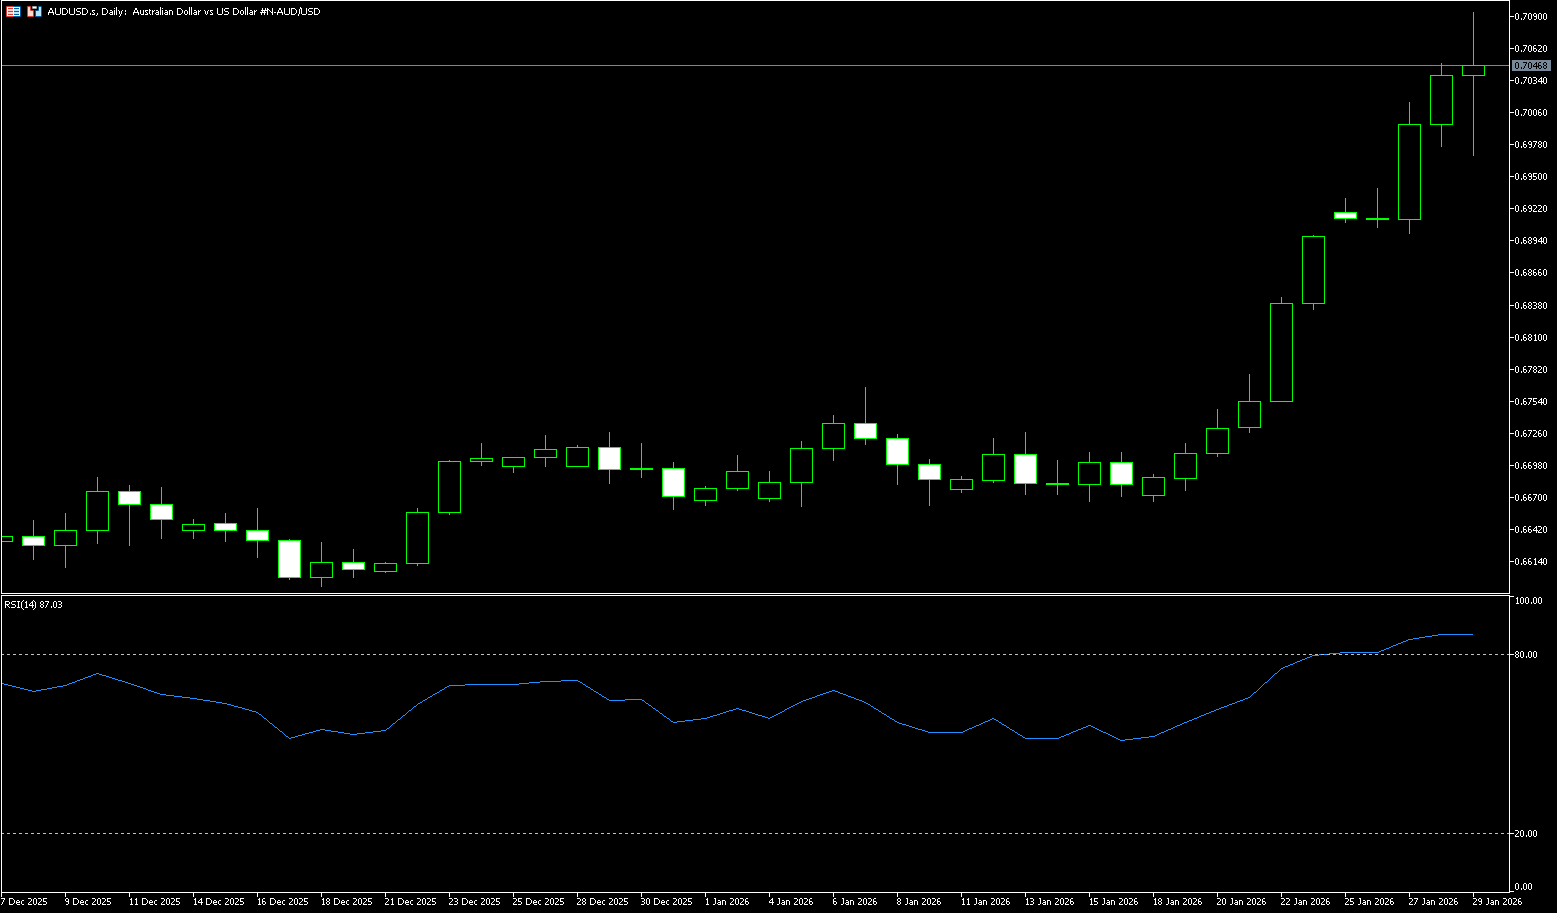
The Australian dollar has recently performed exceptionally well, experiencing a rapid upward trend supported by domestic data, the US dollar, and commodities. Core data released by the Australian Bureau of Statistics on Wednesday showed that the country's December Consumer Price Index (CPI) rose 3.8% year-on-year, exceeding the market expectation of 3.6% and significantly rebounding from the previous value of 3.4% in November; the monthly CPI rose sharply by 1.0%, further confirming the stickiness of inflationary pressures. This indicates that Australia cannot ignore inflation and lower interest rates. In fact, the unexpectedly high inflation rate of 3.8% in December significantly increased the Reserve Bank of Australia's (RBA) decision to raise interest rates at its February policy meeting. Meanwhile, data shows that the Australian economy remains strong even with a high interest rate of 3.6%. In addition to inflation data, recent economic fundamentals in Australia also support a tightening of monetary policy. The S&P Global Manufacturing Purchasing Managers' Index (PMI) for January was 52.4, a steady rise from the previous value of 51.6; the Services PMI surged from 51.1 to 56.0, with a strong labor market providing fundamental support for sticky inflation.
The recent appreciation of the Australian dollar has significantly outpaced the depreciation of the US dollar, demonstrating the attractiveness of the Australian dollar. When the US dollar and commodities move in tandem, it is precisely when commodity currencies like the Australian dollar shine. Technically, the Australian dollar has broken strongly through its upward channel, supported by the 5-day simple moving average, and quickly surged above the psychological level of 0.70. There is still room for further gains before reaching the upper channel line. However, the RSI indicates oversold conditions and is far from the 5-day moving average. If the price continues its strong upward trend, it will likely remain in the high-price zone, awaiting the 5-day moving average and RSI indicator to converge before another breakout. The next target is the 0.7080 level, and after breaking through this level, the next relevant resistance is the high of the week at 0.7157 (February 2nd). Regarding the possibility of a correction, the current low of 0.6977 (Wednesday's low) has become a direct level. From there, the next resistance is 0.6900 (the psychological level).
Consider going long on the Australian dollar around 0.7045 today; Stop loss: 0.7040; Target: 0.7090; 0.7080
GBP/USD
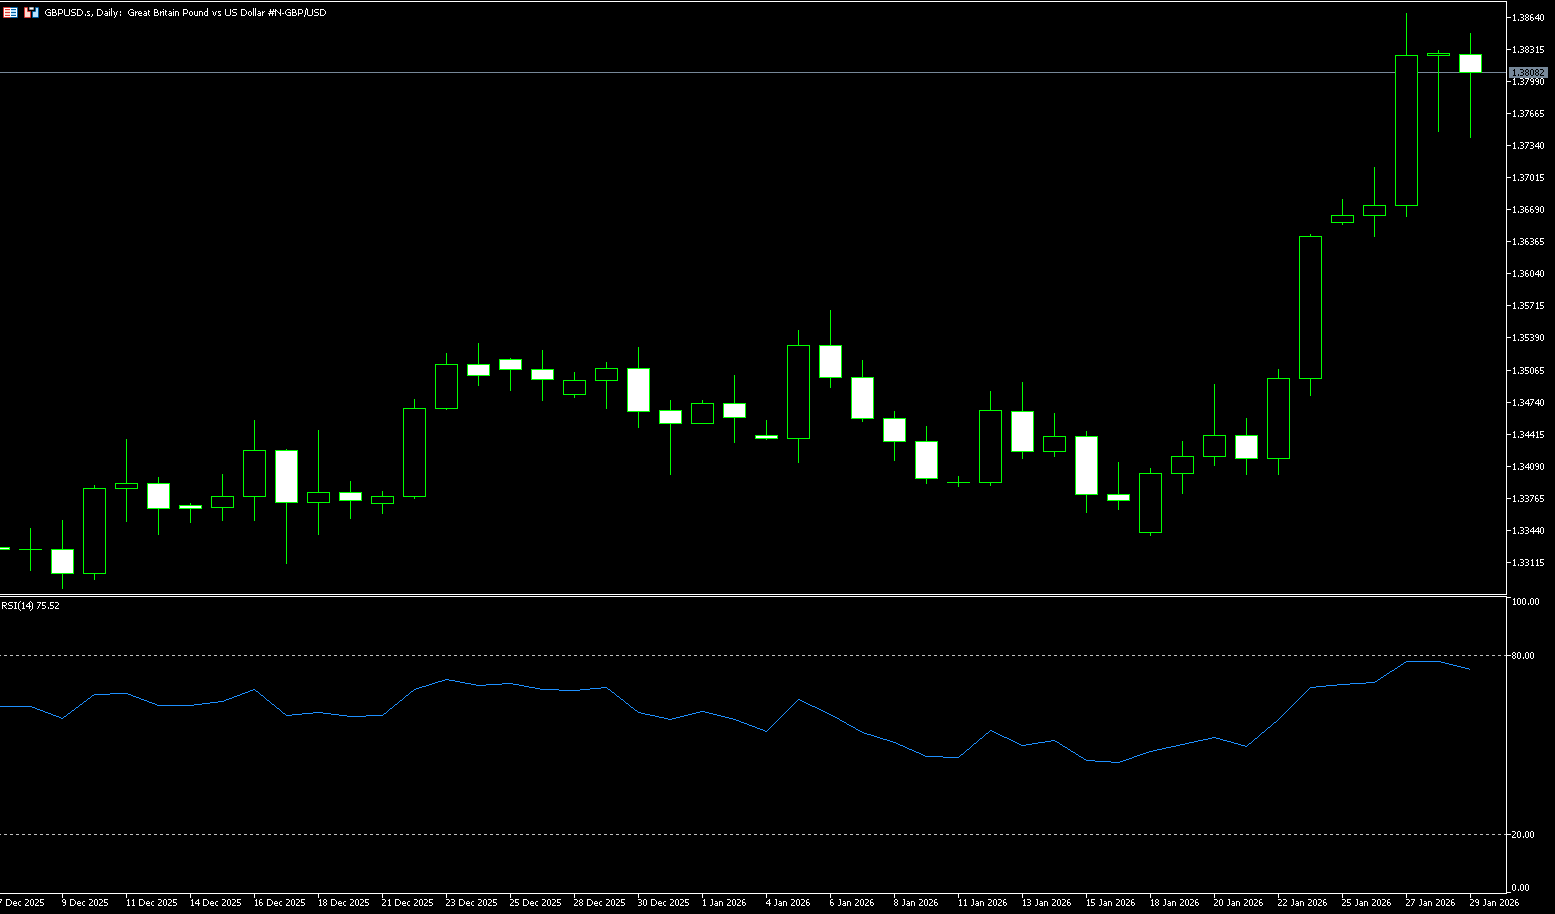
The pound is hovering around $1.38, still close to the August 2021 high reached earlier this week, as increased dollar volatility puts pressure on the currency. Traders are assessing comments from US Treasury Secretary Scott Bessant suggesting the US will not intervene in the foreign exchange market by selling dollars against the yen, and a broader “sell America” trade. Meanwhile, the Federal Reserve kept interest rates unchanged as expected, with Chairman Powell hinting that policy may remain unchanged for some time. In the UK, the Bank of England is expected to keep its benchmark interest rate at 3.75% next week, as inflation rose to 3.4% in December, and recent UK retail sales data showed accelerating price pressures.
Despite the pullback in GBP/USD, the uptrend remains intact, and the dollar is recovering its losses. Considering the fundamental backdrop, the base case scenario suggests the Fed will acknowledge its dual mandate and maintain the status quo. Therefore, further upside potential is favored. The 14-day Relative Strength Index (RSI) on the daily chart has tested the overbought zone at 74.50, indicating some easing of short-term selling pressure. A technical rebound or consolidation is possible. If GBP/USD remains above 1.3800 (a psychological level), the next resistance level will be the yearly high of 1.3869, followed by 1.3900. Conversely, if the Federal Reserve believes the labor market has stabilized and does not mention restrictive policy, the dollar may appreciate, causing GBP/USD to fall to the 1.2750 level and triggering a more significant pullback to 1.3713 (Monday's low).
Consider going long on GBP/USD around 1.3800 today; Stop loss: 1.3790; Target: 1.3850, 1.3860
USD/JPY
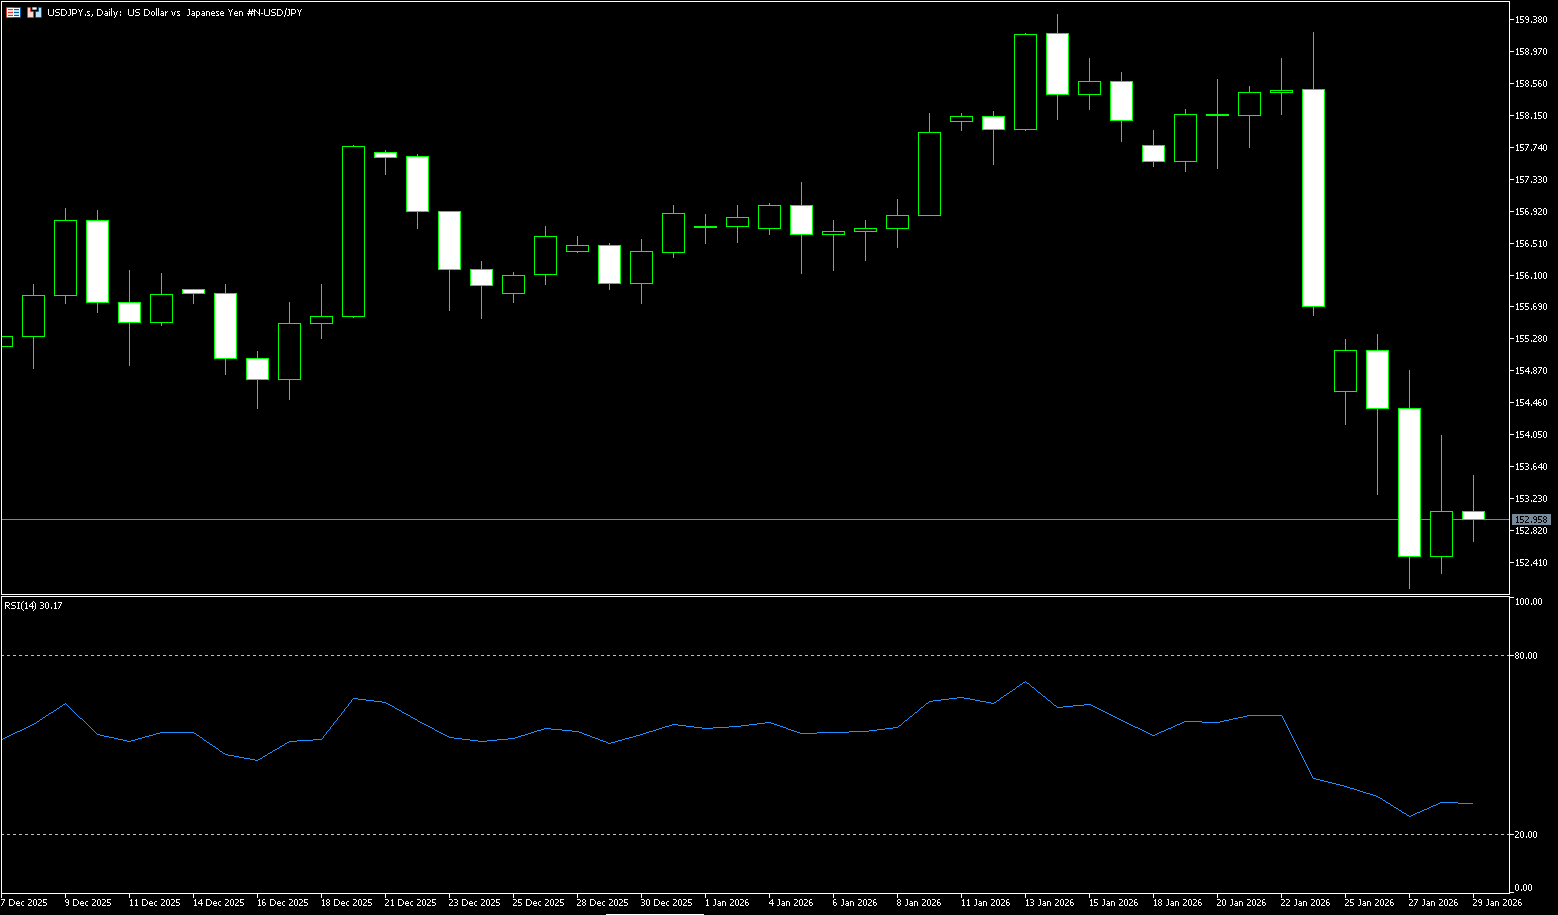
The yen held steady at around 153.10 per dollar on Thursday, after falling nearly 1% in the previous session, as the dollar rebounded after U.S. Treasury Secretary Scott Bessant dismissed speculation that the U.S. was intervening in the currency market to sell dollars for yen. Bessant reiterated the U.S.'s "strong dollar policy" and said sound fundamentals should attract capital inflows, contrasting with President Trump's earlier statement that a weaker dollar was acceptable. Earlier this week, the yen rose about 4%, reaching its highest level in three months, on market speculation that the U.S. and Japan might coordinate intervention to support the yen, after the New York Federal Reserve conducted an interest rate check. Although data from the Bank of Japan indicated that authorities have not yet formally intervened in the market, traders remain cautious about the risk of unilateral action by Tokyo. Political uncertainty is also putting pressure on the yen ahead of the House of Representatives election on February 8.
From a technical perspective, the USD/JPY pair broke below the 100-day moving average at 153.91 during its previous decline, a move considered a significant signal of short-term trend weakness. The price is currently trading below key moving average support, maintaining a bearish overall technical tone, even though the larger-scale trend has not yet completely reversed. Momentum indicators further reinforce this bearish assessment. The MACD indicator is below the zero line, indicating that downward momentum is still accumulating. The Relative Strength Index (RSI) has fallen to 32, nearing oversold territory, suggesting some release of short-term selling pressure and the possibility of a technical rebound or consolidation, but this does not necessarily indicate a trend reversal. Analyzing the retracement structure, if the decline continues, the support level around 152.10 (this week's low) will be the primary focus. A decisive break below this level would target 151.54 (the low of October 29th last year), potentially opening up further downside. Conversely, if the price rebounds, whether it can regain a foothold above the 100-day moving average will be crucial in determining whether the bearish sentiment has eased. A break below this level would target 155.35 (this week's high).
Consider shorting the US dollar today around 153.30; Stop loss: 153.50; Target: 152.40; 152.20
EUR/USD
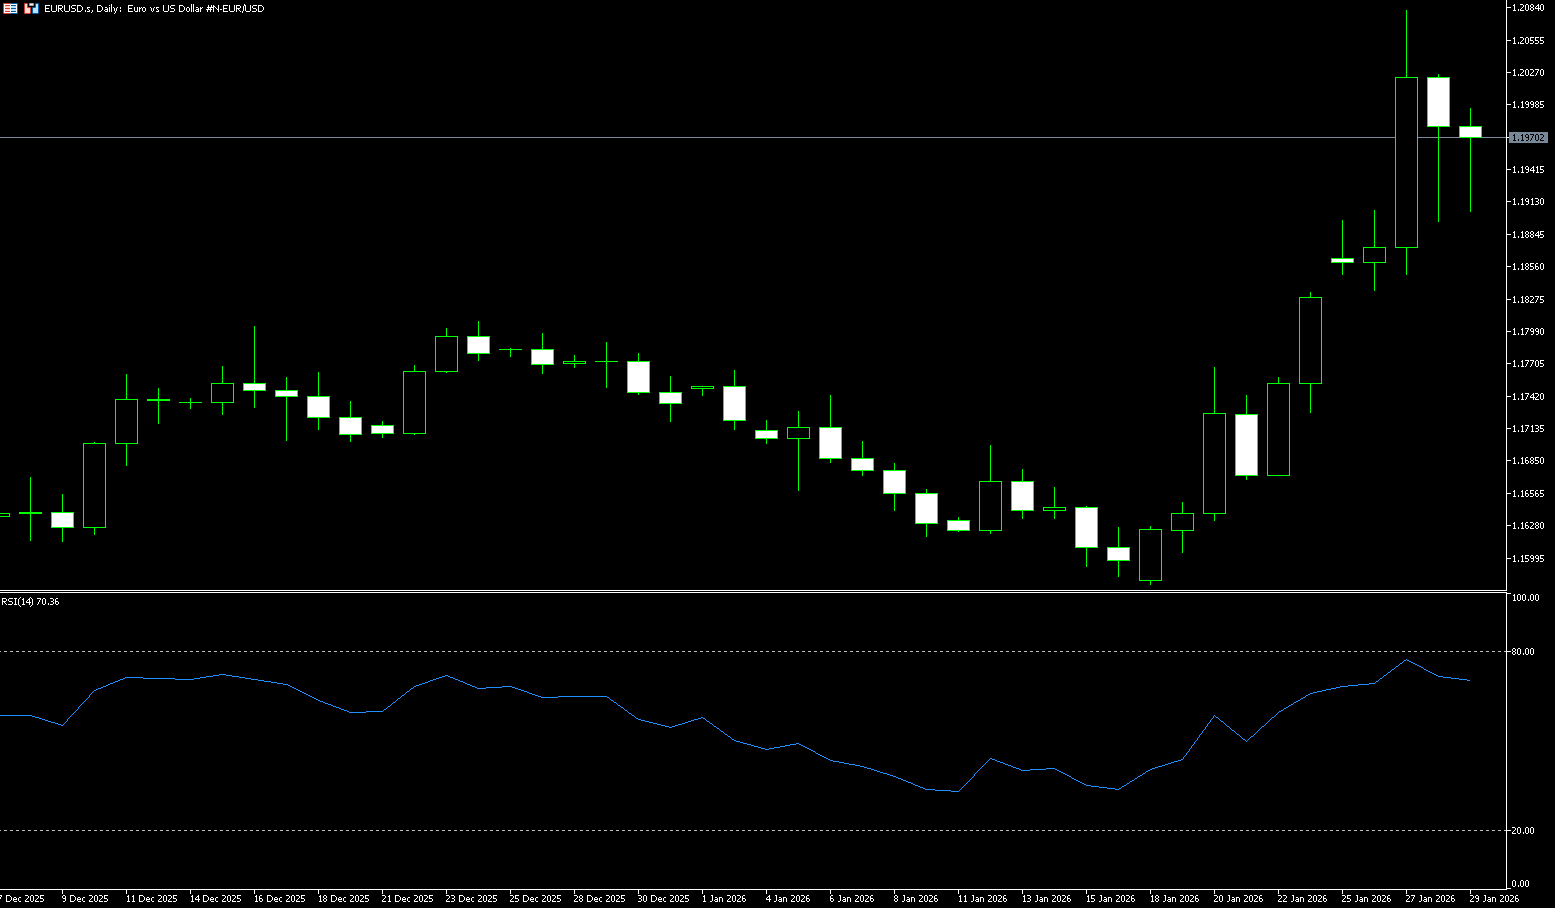
The euro/dollar pair fell below 1.20, retreating to lows near June 2021 levels reached earlier this week, pressured by a stronger dollar after comments from US Treasury Secretary Scott Bessenter reduced market expectations of US intervention in the foreign exchange market by selling dollars against the yen. Meanwhile, the Federal Reserve kept interest rates unchanged as expected, with Chairman Powell suggesting rates might remain unchanged for some time. In Europe, ECB policymaker Martin Koch warned that further euro strength could prompt the central bank to resume rate cuts. Market expectations for summer policy action have moderately increased, with the implied probability of a July rate cut rising from around 15% to around 25%. The ECB is scheduled to decide on monetary policy next week, and is widely expected to keep interest rates unchanged. In the third quarter of 2025, the Eurozone economy grew by 0.3%, while the December inflation rate fell to 1.9%.
The current pullback in EUR/USD is considered temporary, and further upside should remain on track as long as the pair stays above its key 20-day simple moving average at 1.1734. Furthermore, momentum indicators suggest additional upside potential. Specifically, the Relative Strength Index (RSI) is hovering around 68, while the Average Directional Index (ADX) is near 30, indicating a strong trend. A renewed bullish stance should challenge the psychological level of 1.2000, followed by the upper limit of 1.2045 (January 28th, 2026). A break above this level could see the pair turn its focus to the May 2021 high of 1.2266. Meanwhile, initial support is seen in the 1.1900 (psychological level) – 1.1895 (Wednesday's low) range, with the more important 20-day simple moving average at 1.1734 below. A break below this area could pave the way for a move towards the 200-day simple moving average at 1.1606.
Consider going long on the Euro today around 1.1957; Stop loss: 1.1945; Targets: 1.2040, 1.2050
Disclaimer: The information contained herein (1) is proprietary to BCR and/or its content providers; (2) may not be copied or distributed; (3) is not warranted to be accurate, complete or timely; and, (4) does not constitute advice or a recommendation by BCR or its content providers in respect of the investment in financial instruments. Neither BCR or its content providers are responsible for any damages or losses arising from any use of this information. Past performance is no guarantee of future results.
Lebih Liputan


Pendedahan Risiko:Instrumen derivatif diniagakan di luar bursa dengan margin, yang bermakna ia membawa tahap risiko yang tinggi dan terdapat kemungkinan anda boleh kehilangan seluruh pelaburan anda. Produk-produk ini tidak sesuai untuk semua pelabur. Pastikan anda memahami sepenuhnya risiko dan pertimbangkan dengan teliti keadaan kewangan dan pengalaman dagangan anda sebelum berdagang. Cari nasihat kewangan bebas jika perlu sebelum membuka akaun dengan BCR.
BCR Co Pty Ltd (No. Syarikat 1975046) ialah syarikat yang diperbadankan di bawah undang-undang British Virgin Islands, dengan pejabat berdaftar di Trident Chambers, Wickham’s Cay 1, Road Town, Tortola, British Virgin Islands, dan dilesenkan serta dikawal selia oleh Suruhanjaya Perkhidmatan Kewangan British Virgin Islands di bawah Lesen No. SIBA/L/19/1122.
Open Bridge Limited (No. Syarikat 16701394) ialah syarikat yang diperbadankan di bawah Akta Syarikat 2006 dan berdaftar di England dan Wales, dengan alamat berdaftar di Kemp House, 160 City Road, London, City Road, London, England, EC1V 2NX. Entiti ini bertindak semata-mata sebagai pemproses pembayaran dan tidak menyediakan sebarang perkhidmatan perdagangan atau pelaburan.

 English
 简体中文
简体中文
 繁體中文
繁體中文
 Bahasa
Melayu
Bahasa
Melayu
 Tiếng
Việt
Tiếng
Việt
 ไทย
ไทย
 日本語
日本語
 한국어
한국어
 ភាសាខ្មែរ
 español