


0
Currency & Commodity Analysis:
US Dollar Index
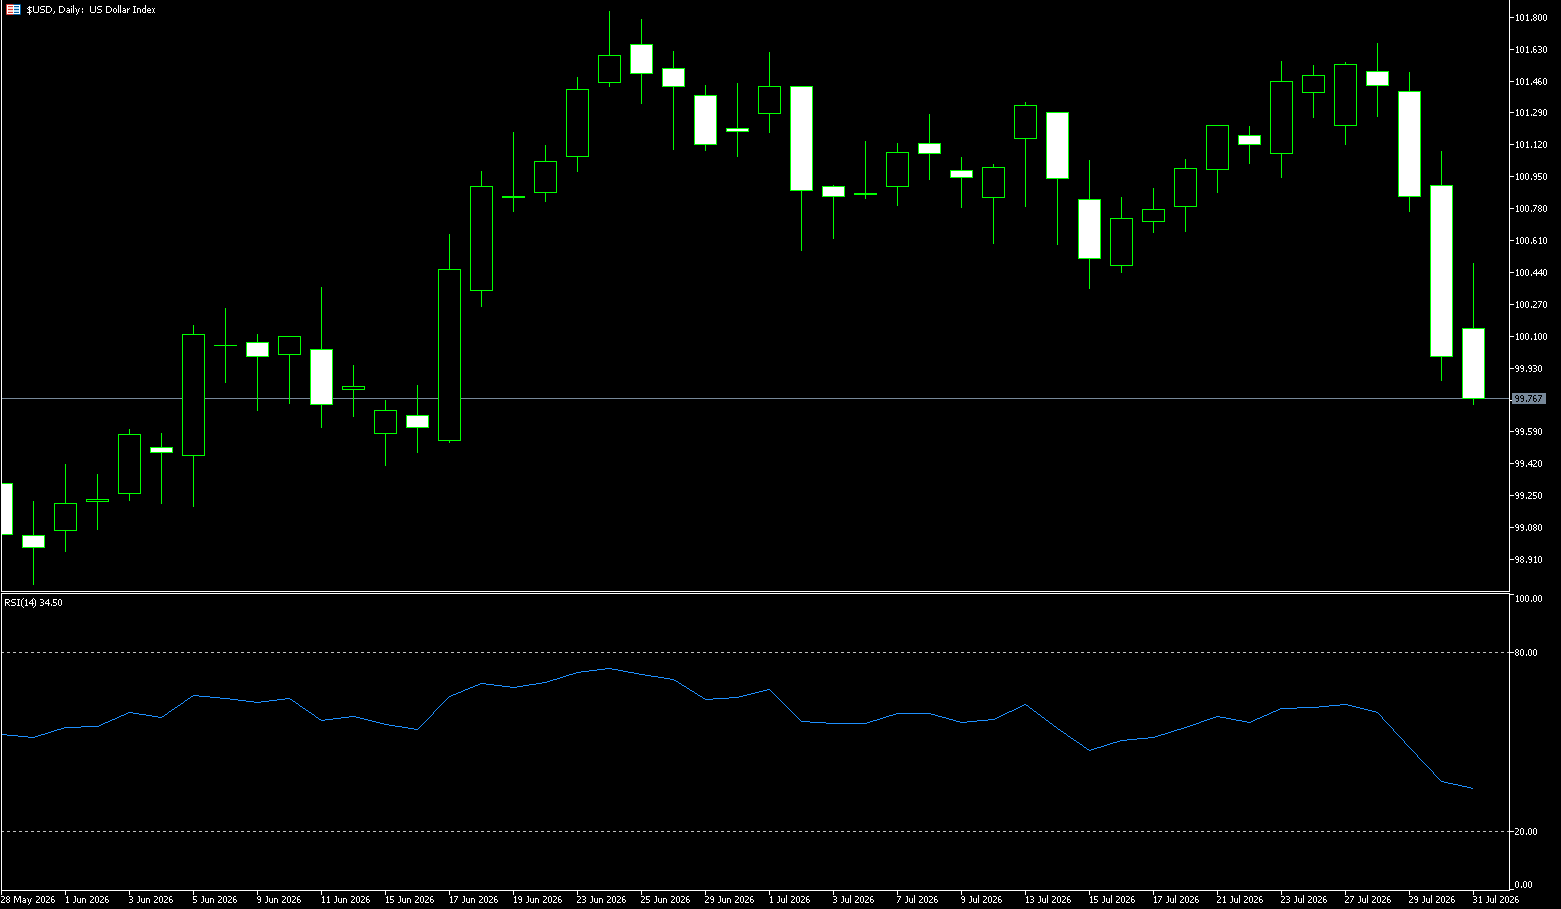
The US dollar attempted to end its three-day losing streak before the end of last week. The dollar index, which tracks the dollar's value against six major currencies, briefly climbed back above the psychologically important 100 mark before closing near 99.70, down 1.65% for the week. The dollar fell sharply in the latter half of the tenth week as financial markets worried that the Federal Reserve would not raise interest rates despite inflation remaining well above the central bank's 2% target. After three consecutive days of declines, the dollar index is expected to fall more than 1% last week, pressured by the Fed's cautious policy stance and Japanese currency intervention to support the yen. On Thursday, the dollar plunged as much as 3.3% against the yen as Tokyo was seen as re-entering the foreign exchange market, and US Treasury Secretary Scott Bessant stated that the yen was "significantly undervalued" and considered excessive currency volatility unhealthy.
Meanwhile, despite renewed hostilities in the Middle East increasing inflation risks, the Federal Reserve kept interest rates unchanged this week, despite three FOMC members voting in favor of a rate hike. The market is still pricing in a roughly 63% probability of a 25 basis point rate hike by the Fed in September. Additionally, investors expect political pressure in the US to prevent the Fed from raising rates. Before the policy statement was released, US President Trump explicitly told Federal Reserve Chairman Warsh, rather than in person, to lower interest rates, adding that there was a good inflation report recently, costs were falling rapidly, and prices should drop significantly once the Gulf War ended.
Last week, the US dollar index reached a high of 101.39 and a low of 99.70; the weekly chart closed with a large bearish candle, continuing its downward trend from the previous upper edge of the consolidation range, with a weekly decline of approximately 1.65%. The trend can be clearly divided into two phases: the first half of the week saw narrow fluctuations between 101.00 and 101.40, with the market awaiting the Fed's July interest rate decision; after the FOMC decision was released early Thursday morning, long positions were liquidated, and prices began a continuous decline, further falling below the 100 level on Friday. The price movement can be clearly divided into two phases: The first half of the week saw narrow fluctuations between 101.00 and 101.40, with the market awaiting the Fed's July interest rate decision; after the FOMC decision was released early Thursday morning, long positions were liquidated, triggering a continuous decline, with prices falling further on Friday and breaching the 100 level. Last week's technical summary (weekly chart): A large bearish candlestick pattern emerged after a surge followed by a pullback, with prices effectively breaking below the 5-week moving average, indicating the fading of the bulls' temporary advantage and a formal transition to a mid-term consolidation phase; the RSI has retreated from its highs but has not yet entered oversold territory, suggesting continued downward momentum. Key level change: 100.00 has shifted from strong support to the first level of resistance.
The US dollar index rose back above 100 before the weekend, but as it remains below the 50-day simple moving average of 100.50, the short-term tone remains bearish. A double-top pattern near 100.40 has broken support, indicating a potential for further declines. The index has retreated from recent highs and continues to be pressured by this short-term trend indicator, while the 14-day Relative Strength Index (RSI) is around 35, indicating that downward momentum is weakening, but a decisive rebound has not yet occurred. Therefore, initial resistance next week: On the upside, the 50-day simple moving average at 100.50 is the immediate resistance that bulls need to recover to alleviate current bearish pressure and rise back to the vicinity of the 50-day simple moving average at 100.50 and 100.45 (last Friday's high). On the downside, the pair is expected to continue its decline to the June 15 low of 99.38; a break below this level would target the psychological level of 99.00.
Consider shorting the US Dollar Index at 99.90 today, with a stop loss at 100.00 and targets at 99.55 and 99.45.
WTI Crude Oil
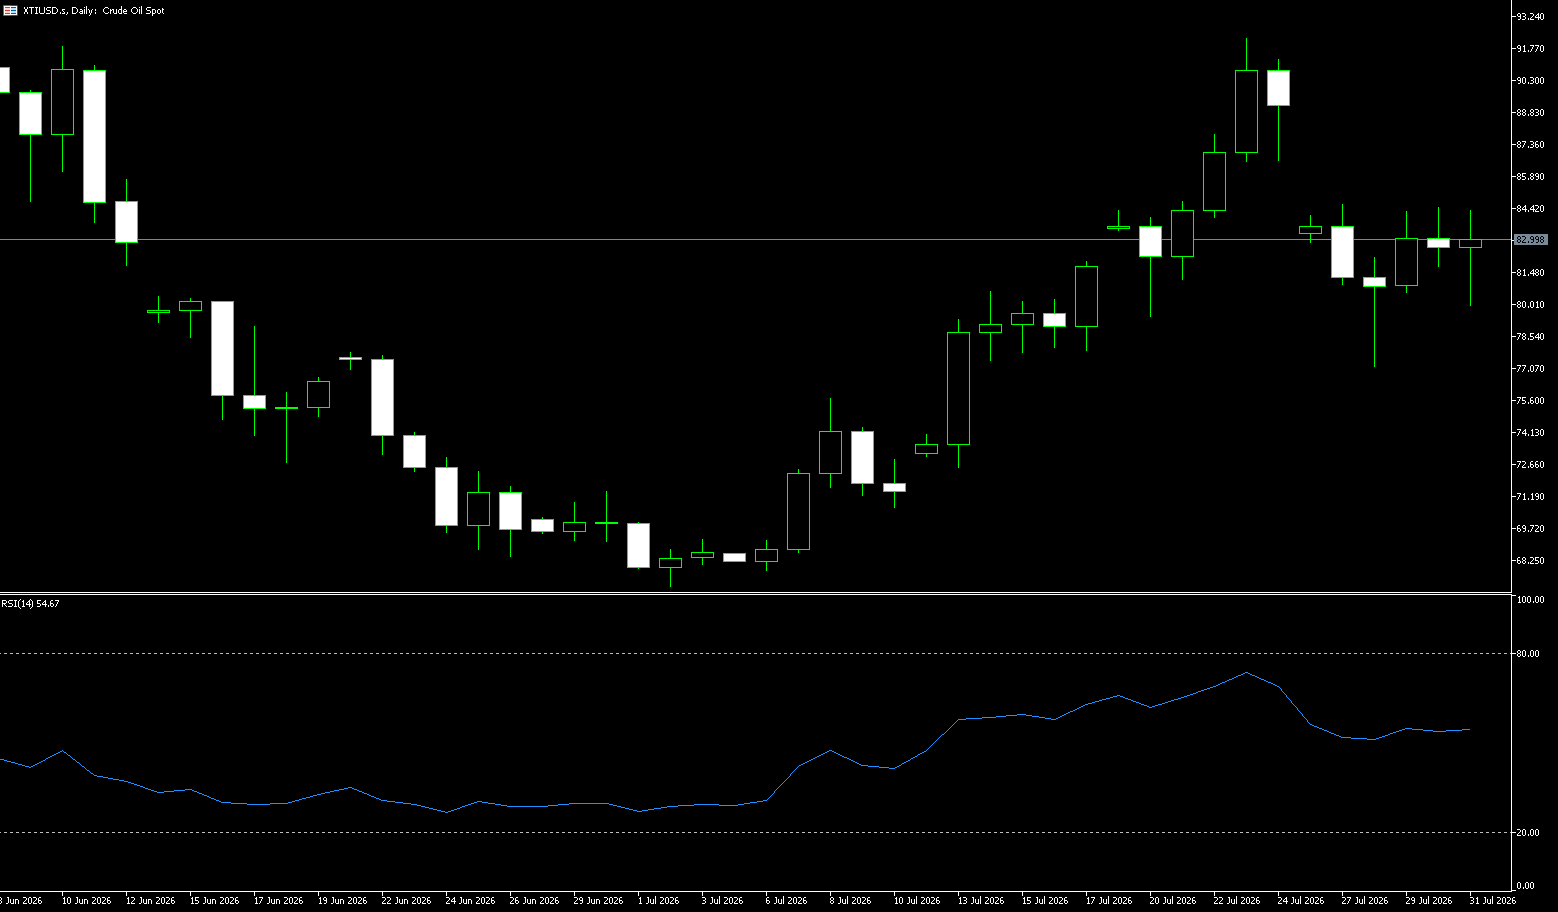
WTI crude oil prices rose 1% on Friday to around $85 a barrel before the weekend, ending a more than 20% gain in July, the strongest monthly increase since March, driven primarily by escalating geopolitical tensions and concerns about global oil supplies. Iran claimed to have attacked two oil tankers escorted by US forces through the Strait of Hormuz, although Western maritime authorities have not yet confirmed the incident. Renewed conflict between the US and Iran, the Houthi attacks in the Red Sea, and Saudi Arabia's strikes against Iranian supporters have increased risks to key shipping routes. A decline in US crude oil inventories further increased upward pressure on prices. Meanwhile, attacks near Russian Black Sea oil export infrastructure, including the Caspian Pipeline Consortium (CPC) terminal, increased concerns about disruptions to Kazakh oil exports, a significant source for European refiners. Despite the CPC's decision to continue operations, concerns about supply security continue to support higher oil prices. The recent correction in WTI crude reflects the market repricing the possibility of reduced Middle East supply risks, but the current high price level suggests that investors have not completely dispelled concerns about energy supply disruptions. The resumption of shipping in the Strait of Hormuz, anticipated US-Iran negotiations, and progress on the Red Sea security mechanism are expected to reduce short-term risk premiums. However, disruptions to Black Sea exports and uncertainties surrounding regional conflicts continue to support oil prices. The crude oil market is likely to maintain a highly volatile pattern in the future. If diplomatic progress continues to improve, oil prices may further release previously accumulated risk premiums; however, if the supply chain is disrupted again, the market may quickly repric. Investors need to focus on geopolitical situations, global inventory changes, and the stability of exports from major oil-producing regions to find new trading opportunities in this volatile environment.
WTI crude oil continued its downward trend at the beginning of the week, following the previous week's de-escalation of geopolitical tensions. Risk premiums were quickly cleared, with WTI hitting a low of around $80.6. For the remainder of the week, it entered a wide trading range of $77.13 (27-day moving average) – $85.15 (last week's high). With a gain of over 20% in July, the weekly range was close to $7, indicating significant divergence between bulls and bears. From a momentum perspective, the upward momentum on the daily chart has slowed, but due to the persistent geopolitical risk premium, it is difficult for the bears to form a clear trend reversal in the short term. Expectations of easing tensions lead to concentrated profit-taking by long positions, causing a rapid decline in oil prices; conversely, expectations of renewed escalation of the conflict lead to a rapid return of funds to long positions, pushing up oil prices. The fluctuating geopolitical premium causes volatile price swings.
From a daily chart perspective, WTI crude oil has recently entered a consolidation phase after a rapid rise. Although prices have fallen for several consecutive trading days, the overall trend remains bullish. From a momentum perspective, the upward momentum on the daily chart has slowed, but due to the persistent geopolitical risk premium, it is difficult for the bears to form a clear trend reversal in the short term. Previously, oil prices were driven by supply risks to break through key areas and are currently still trading above the medium-term moving average, indicating that the bullish trend has not been completely broken. The current support area to watch is around $77.16 (last week's low) to $77.00 (psychological level). If this area holds, oil prices may retest the resistance area around $88.02 (100-day moving average) to $90.00 (psychological level). A break below $80 could lead to a further pullback to the support area around $77.16 (last week's low) to $77.00 (psychological level).
Consider going long on crude oil today at $84.85, with a stop loss at $84.65 and targets of $87.00 and $88.00.
Spot Gold
Gold was on track for its first monthly gain in five months last week. Despite renewed hostilities in the Middle East causing inflationary pressures, the Federal Reserve kept interest rates unchanged, supporting the precious metal. However, market expectations of tighter monetary policy continued to limit gains, with the market currently pricing in a 63% probability of a Fed rate hike in September. Meanwhile, the US military launched new strikes against Iranian targets in retaliation for Tehran's attack on US assets in the Middle East, reducing the likelihood of a near-term diplomatic agreement. Since the outbreak of the US-Iran war in late February, gold has faced continuous pressure, with soaring oil prices exacerbating inflation concerns and strengthening expectations of tighter monetary policy.
The seesaw effect between gold and the US dollar was vividly demonstrated in the market on July 30th. On that day, the US dollar index fell sharply by nearly 0.90%, briefly dipping below the 100 mark to 99.90 points. The direct consequence of a weaker dollar is that dollar-denominated gold becomes cheaper for overseas buyers, providing the most direct monetary support for rising gold prices. However, behind this round of dollar depreciation lies a more dramatic story—the violent appreciation of the Japanese yen. This sharp fluctuation in exchange rates created a double benefit for gold: on the one hand, the overall weakening of the dollar directly reduced the cost of holding gold; on the other hand, the market uncertainty caused by the surge in the yen further strengthened gold's safe-haven attributes.
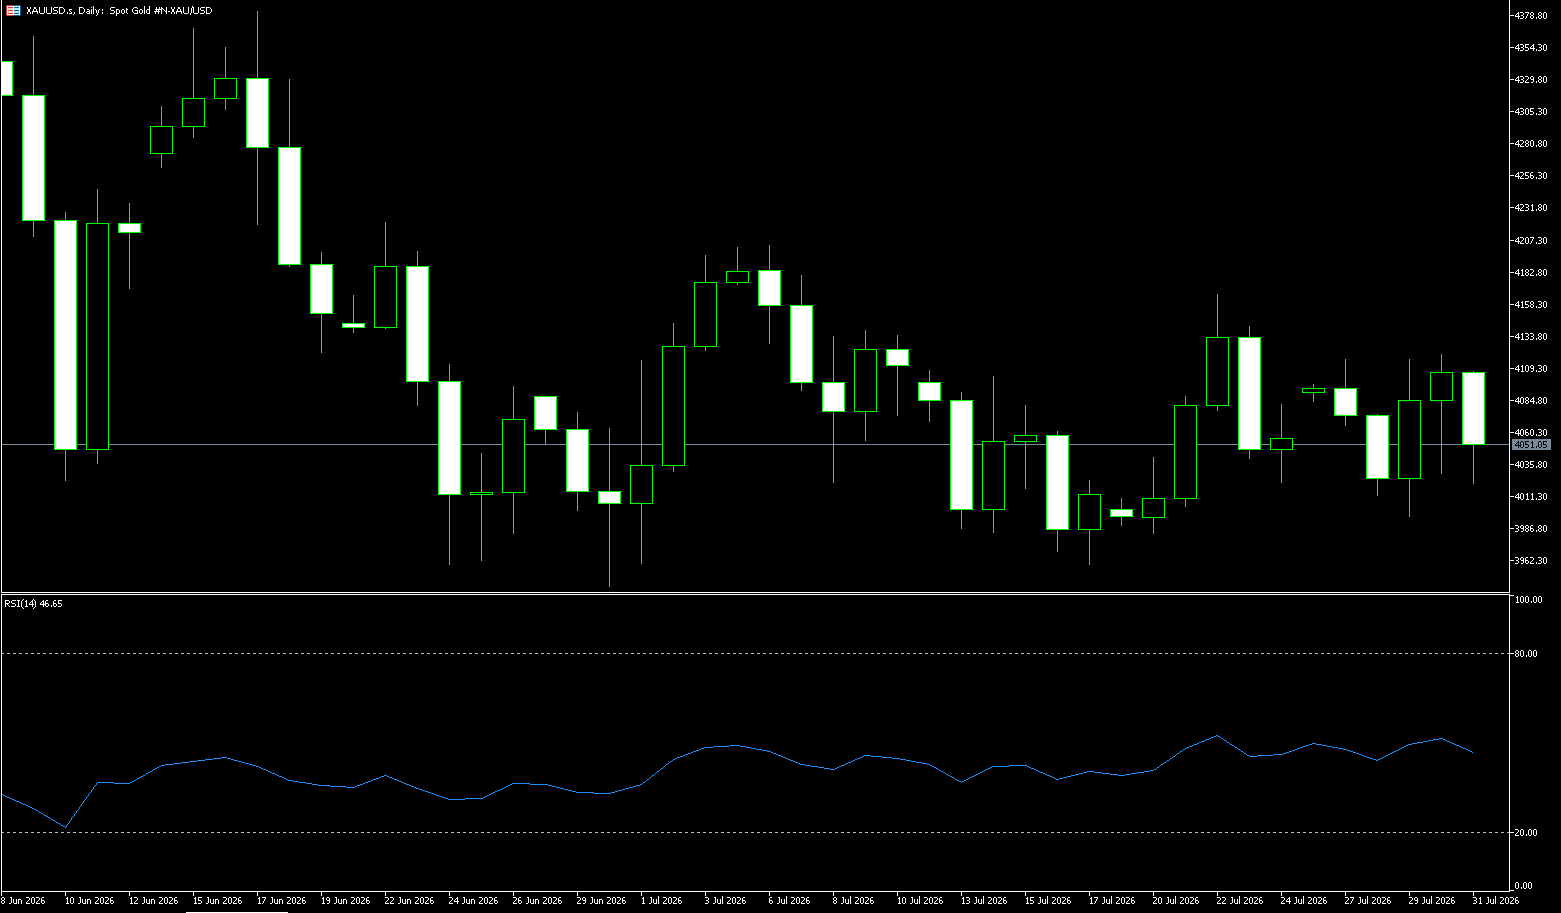
Last week, the Federal Reserve kept interest rates unchanged, and the press conference was hawkish: the possibility of further rate hikes was left open, and several committee members supported rate hikes. In the short term, the US dollar and US Treasury yields fell first and then rebounded; gold rose briefly to 4,120, then the bullish momentum weakened; before the weekend, it entered a period of high-level consolidation, repeatedly failing to break through the 4,110-4,120 resistance level, and month-end fund rebalancing suppressed the upward space, falling back to around 4,050 and consolidating. The overall trend for gold remains downward, but after entering August, seasonal factors are more favorable for gold bulls. The daily chart clearly shows that the Relative Strength Index (RSI) (14) is about 47, slightly below the midline, suggesting weak momentum and reinforcing the view of consolidation in a broader downtrend. The psychological level of $4,000 provides solid support for gold prices. Based on market conditions, the US dollar index is likely to fall back to the 100 level, coupled with the strong rebound of gold prices at key support levels, so it is crucial to be wary of gold prices breaking through the $4,200 resistance level. On the daily chart, gold is trading around $4,050-$4,060, maintaining a short-term bearish bias as spot prices remain below key simple moving averages. The 50-day simple moving average, at $4,185.30, along with last week's high of $4,120.50, is above the current price, indicating that any rebound is still limited to a broader correction phase, while the psychological level of $4,000 provides near-term dynamic support. On the upside, initial resistance is located near the psychological level of $4,100 and last week's high of $4,120.50; a daily close above this resistance would help alleviate immediate bearish pressure and pave the way for further challenges to the 50-day simple moving average at $4,185.30 and the psychological level of $4,200. Below, the first support level is at the psychological level of $4,000; a sustained break below this level would expose a lower support zone, specifically $3,969.50 (July 16 low) and $3,941.70 (June 30 low), suggesting sellers regain control of the daily chart structure.
Consider going long on gold today at 4,037, with a stop loss at 4,030; targets: 4,080; 4,090.
AUD/USD
The Australian dollar consolidated its strong gains against the US dollar in the latter part of last week, holding above 0.7000, ignoring weak official Chinese PMI data. Meanwhile, the continued US pressure on Iran pushed up geopolitical risk premiums, providing some support for the safe-haven US dollar and limiting the pair's gains. China's National Bureau of Statistics manufacturing PMI fell to contraction territory at 49.2 in July, down from 50.3 in the previous month and below market expectations of 50.0. Similarly, the non-manufacturing PMI fell to 49.0, also below expectations of 50.0, highlighting continued weakness in Australia's largest trading partner. The latest data showed further easing of price pressures, with the annual inflation rate slowing to 3.8% from +4.0%. This marginal slowdown in overall inflation reinforced the view that underlying price momentum is gradually cooling, helping to curb market expectations of further tightening by the Reserve Bank of Australia in the near term and keeping the Australian dollar on a softer note.
The Australian dollar rose above US$0.70, reaching its highest point in six weeks and is on track for a weekly gain, as the general weakness of the US dollar outweighed the diminishing expectations of further domestic interest rate hikes. Markets offered little indication that the Reserve Bank of Australia (RBA) would raise interest rates at its August meeting, and the probability of a rate hike by December was only 50%, following lower-than-expected second-quarter inflation data that reduced the need for further policy tightening. Despite a slight easing of global risk aversion due to positive diplomatic developments, the US dollar remained strong. Tensions in the Middle East showed signs of de-escalation as negotiations between the US and Iran progressed towards restoring stability in the Strait of Hormuz. Further boosting market sentiment was US President Trump's announcement of a historic agreement aimed at disarming Hamas and withdrawing Israeli troops from Gaza, reportedly confirmed by senior Hamas officials.
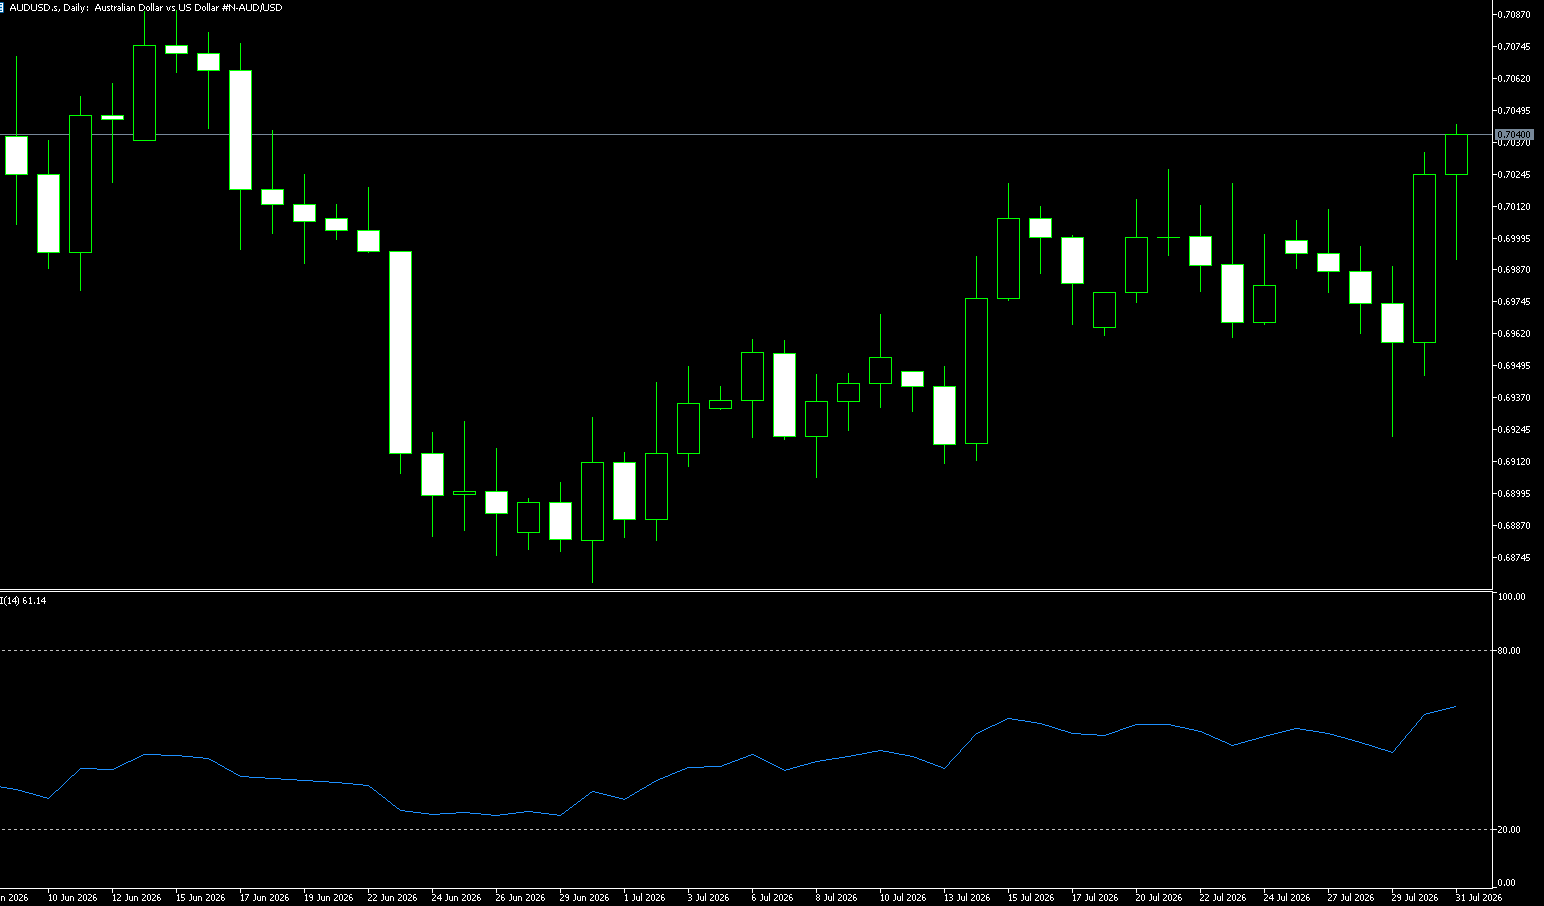
The Australian dollar/US dollar pair traded in a range last week, initially rising before encountering resistance and retreating from its highs. At the beginning of the week, it tested the strong resistance zone of 0.7035–0.7040, failing to hold above it after several attempts. Lower-than-expected Australian CPI data dampened expectations of a RBA rate hike, coupled with a strengthening US dollar, causing the exchange rate to decline, briefly testing support at 0.6950. It then rebounded above 0.7000 before the weekend. The exchange rate has repeatedly faced resistance in the 0.7020-0.7030 supply zone, forming a multiple top resistance. The RSI has broken above the 50 neutral line, indicating that this move is an overstretch rather than a breakdown, and the real risk comes from a second intervention by Japan, not any planned event in Canberra. The MACD has turned downwards above the zero line, indicating waning bullish momentum and a period of consolidation. Short-term structure: oscillating with a corrective bias, trading within a large range of 0.6900–0.7040.
Currently, as long as 0.7000 holds, the bias remains bullish, targeting 0.7100. A break below 0.7000 would return the pair to the range it has been in since June. At present, the first resistance level is 0.7053 (100-day moving average). If the daily close is above this level, it will open up the 0.7100 (psychological level), with the May high at 0.7200 (May 29th high) as the next resistance. As for support, 0.7000 is the pivot point. Below that is 0.6946 (last Thursday's low), and further down is the 200-day exponential moving average at 0.6911, which is slightly above 0.6900 and has flattened out, holding above every test since early July.
Consider going long on the Australian dollar today at 0.7010, with a stop loss at 0.7000 and targets at 0.7060 and 0.7070.
GBP/USD
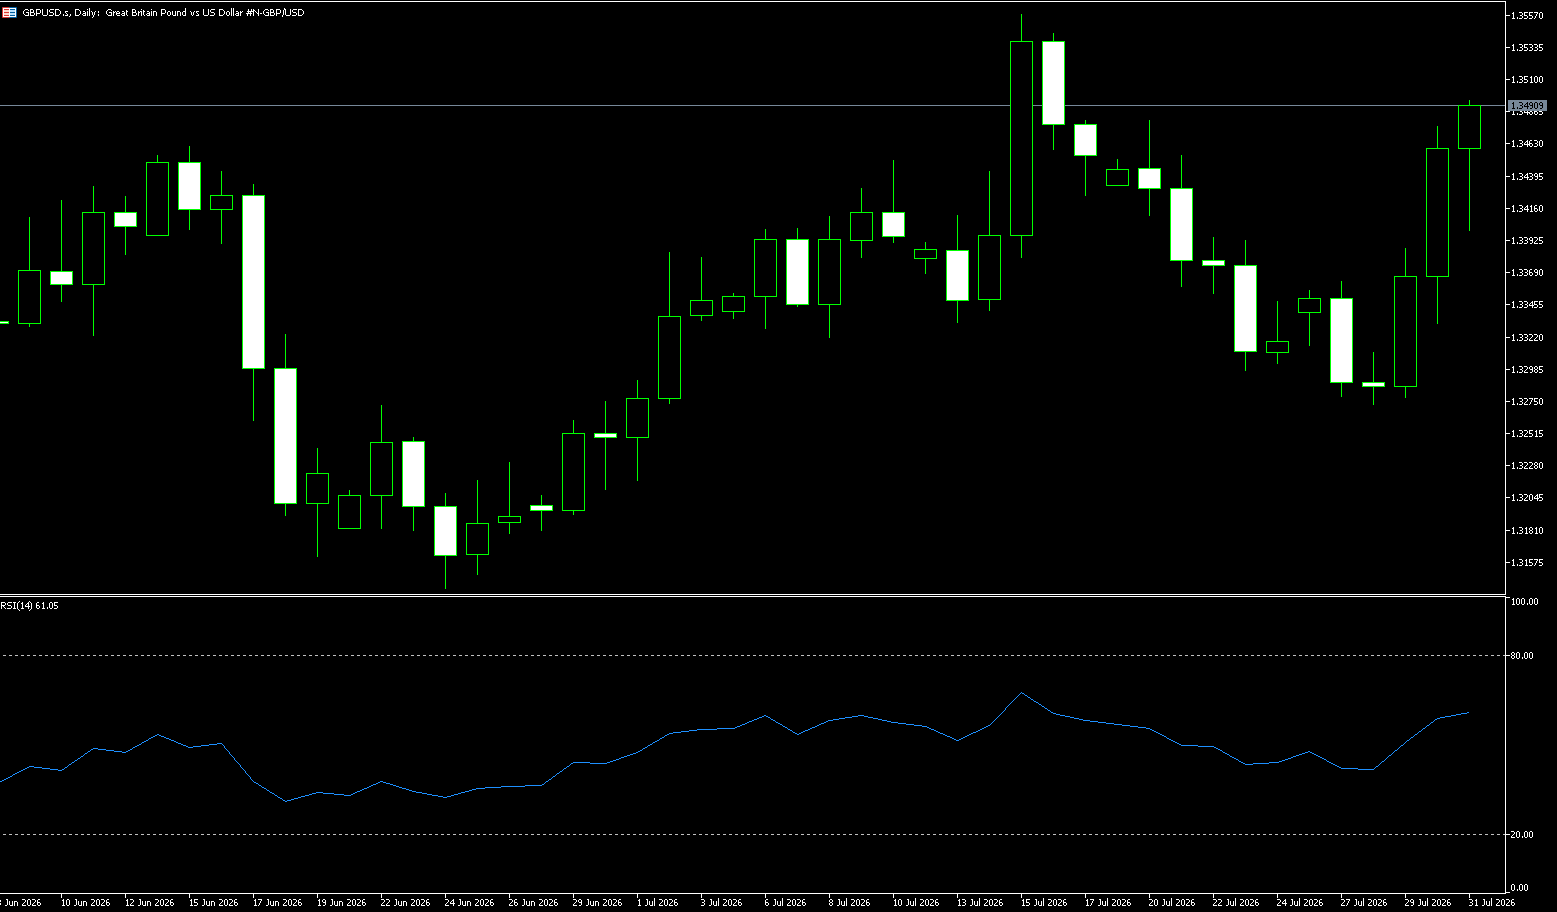
The Bank of England kept its benchmark interest rate at 3.75% for the fifth consecutive meeting last week. The Monetary Policy Committee (MPC) voted 6-3, with three members supporting an immediate 25 basis point rate hike, compared to market expectations of a 7-2 vote. GBP/USD is trading above 1.3470. This rally broke directly through the 50-day and 200-day exponential moving averages (EMAs), which converge just below 1.3400, indicating a range rather than a defensive stance. Last week, GBP/USD saw a rise followed by a pullback, consolidating within a range. Driven by the decisions of the Federal Reserve and the Bank of England: the week's high was 1.3476 and the low was 1.3273. The pound's failure to hold up against the euro's hawkish surprise was not a technical accident. Burnham became Prime Minister on July 20th, appointing John Healey as Chancellor of the Exchequer, and opened with a call for flexibility within inherited fiscal rules. UK gilt yields reacted immediately, with the 10-year yield rising above 5% and the 30-year yield approaching 5.75%, among the highest in the G7.
This is the difference between a hawkish central bank and a hawkish central bank in a country burdened with financing problems. The current higher interest rates in the UK are interpreted as a risk premium rather than yield attractiveness; this interpretation remains unchanged ahead of the October budget, which includes approximately £24 billion in deferred spending and tax measures. Until the budget addresses this issue, the pound will continue to translate positive news into small gains and negative news into sharp declines. GBP/USD remains a dollar instrument ahead of the Bank of England's September meeting, which accurately reflects the current trading session: the pound's own central bank's unexpectedly hawkish stance resulted in a 20-pip gain against the euro.
The pound's rebound against the dollar last week, from a low of 1.3273 to a near two-week high of 1.3495, stalled as selling pressure persisted above the psychological level of 1.3500. Despite later pressure, GBP/USD still recorded weekly gains, reversing some of last week's sharp decline. The daily chart shows GBP/USD trading with a slight bearish bias. The spot price is fluctuating around the 34-day simple moving average, currently around 1.3445, indicating that the pair is consolidating below a resistance zone after a recent pullback. The 14-day Relative Strength Index (RSI) is around 59, suggesting that bullish momentum is gradually recovering but lacks a clear short-term direction. The MACD is hovering around the zero line, indicating a balance between bullish and bearish momentum. This suggests there is still room for upside, not a reversal of the trend, although the current rebound is driven by the US dollar, not the pound.
Next week, GBP/USD is expected to trade within a range, awaiting a breakout; the downside risk is slightly higher. The key level is 1.3400. If the pair continues to hold above the 1.3400 level (daily close above), the range-bound pattern will shift to a bullish bias; the first resistance level is 1.3500, just above the session high. If the daily close is above this level, it will open up space towards 1.3558 (July 15 high), while 1.3650, near the mid-July rally area, is the next important obstacle. Regarding support levels, a decisive break below 1.3400 will open up downside potential. 1.3400 is currently a pivot point; a break below 1.3400 will bring 1.3364 (50-day simple moving average) back into focus, followed by 1.3300 (psychological level).
Today, consider going long on GBP at 1.3468, with a stop-loss at 1.3455 and targets at 1.3530 and 1.3540.
USD/JPY
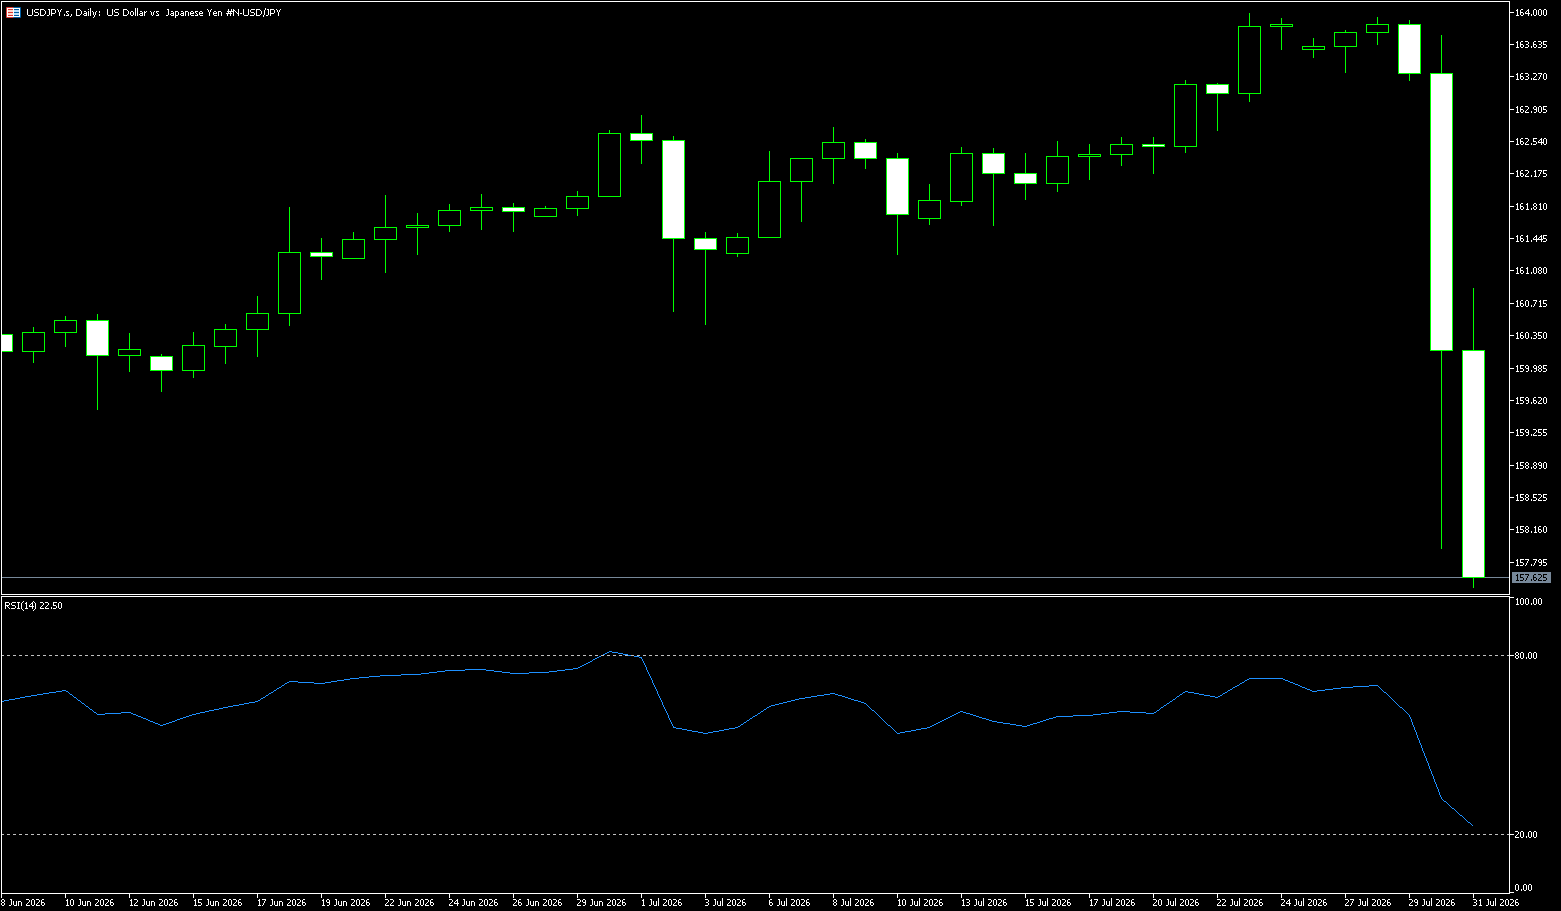
The USD/JPY pair closed last week at 157.35, a weekly drop of 3.95%, an extremely rare weekly fluctuation recently. Following a two-day monetary policy meeting on Friday, the Bank of Japan board decided to keep short-term interest rates unchanged at 1.00%. The decision was in line with market expectations. The Bank of Japan approved its interest rate policy decision with 8 votes in favor and 1 against. Late last week, the yen experienced a rare rapid rebound, with the USD/JPY exchange rate falling from above 163 to below 158 within minutes, sparking speculation that Japanese authorities might intervene in the foreign exchange market. This sharp fluctuation shifted the market's focus from the Bank of Japan's meeting. Previously, investors generally believed that the Bank of Japan would likely maintain its policy rate at this meeting, but the sudden strengthening of the yen has led the market to pay closer attention to the central bank's stance on exchange rate fluctuations, inflationary pressures, and the future path of interest rate hikes. However, investors still expect the Bank of Japan to continue tightening policy this year, with the October and December meetings considered potential windows for rate hikes.
The long-term weakness of the yen is also a significant factor of concern for the Bank of Japan. A weak yen increases the cost of imported goods and energy, potentially further fueling domestic inflationary pressures. Although the market believes that the yen's short-term pressure has eased after the suspected intervention in the foreign exchange market by Japanese authorities, past experience shows that without monetary policy support, the yen's weakness trend could re-emerge. If the Bank of Japan (BOJ) releases a hawkish signal while the US dollar continues to weaken, the USD/JPY pair may decline further as expectations of a narrowing interest rate differential between the two countries strengthen. Conversely, if the BOJ maintains a cautious stance and the market refocuses on US economic data, the USD/JPY pair may experience a technical rebound.
In the short term, if the BOJ reinforces its assessment of inflation and wage growth while the US dollar continues to be under pressure, the USD/JPY pair may continue its downward trend. Investors will need to pay close attention to the BOJ's policy rhetoric, US economic data, and yen exchange rate fluctuations. The market is currently shifting from simply focusing on carry trades to reassessing the normalization process of Japan's monetary policy, and the USD/JPY pair may enter a period of high volatility. From a daily chart perspective, after a rapid decline, the short-term trend of the USD/JPY pair has clearly weakened, currently trading around 157.35, with increased short-term bearish pressure. However, the medium- to long-term upward structure has not been completely broken. In terms of technical momentum, the RSI indicator is approaching 24, indicating that the market has entered oversold territory in the short term, which may limit further downside potential, but the trend remains cautious until it regains a foothold above key moving averages.
The current price is testing a key support area. Key support levels to watch are 158.00 (psychological level), 157.98 (Thursday's low), and the 200-day moving average around 157.97. A break below these levels would target the 157.00 level, which also coincides with the 230-day moving average at 156.90. A sustained hold above this level could lead to a rebound. However, a daily close below the key support around 156.90-157.00 would suggest a deeper correction towards 155.04 (May 6th low). On the upside, initial resistance is at 160.00 (100-day moving average) and 160.00 (psychological level), with stronger resistance at 160.88 (last Friday's high).
Today, consider shorting the US dollar at 157.55, with a stop loss at 157.70 and targets at 156.00 and 155.50.
EUR/USD
The US dollar closed at 157.35 against the Japanese yen last week, a weekly drop of 3.95%, an extremely rare weekly fluctuation recently. Stronger-than-expected Eurozone economic data strengthened market expectations for a possible second rate hike by the European Central Bank this year, possibly as early as September, offsetting concerns about escalating tensions in the Middle East and disagreements within the Federal Reserve. The Eurozone economy grew by 0.4% in the second quarter, exceeding the expected 0.2%, marking the strongest growth since early 2025. Spain led the way with a 0.7% increase, while Germany, France, and Italy each grew by 0.2%. Inflation data from Germany and Spain also supported expectations of further policy tightening. Meanwhile, a new round of US airstrikes against Iran pushed up oil prices and put pressure on risk sentiment. Despite three Federal Open Market Committee members supporting a rate hike, the Federal Reserve kept interest rates unchanged on Wednesday, increasing policy uncertainty.
According to The Guardian, the speaker of the Iranian parliament said on Thursday that the United States will pay the price for killing Iranian civilians. The Iranian Islamic Revolutionary Guard Corps (IRGC) stated on Thursday that it has targeted US military bases in Kuwait, Jordan, and Bahrain after the US bombing of a building on Iran's island of Hormuz. The Iranian military added that the Strait of Hormuz will remain closed, and "aggressors will be punished." Stronger-than-expected GDP data from the Eurozone and Germany reinforced market expectations for a possible second rate hike by the European Central Bank this year, possibly as early as September. This, in turn, could help limit the common currency's short-term decline.
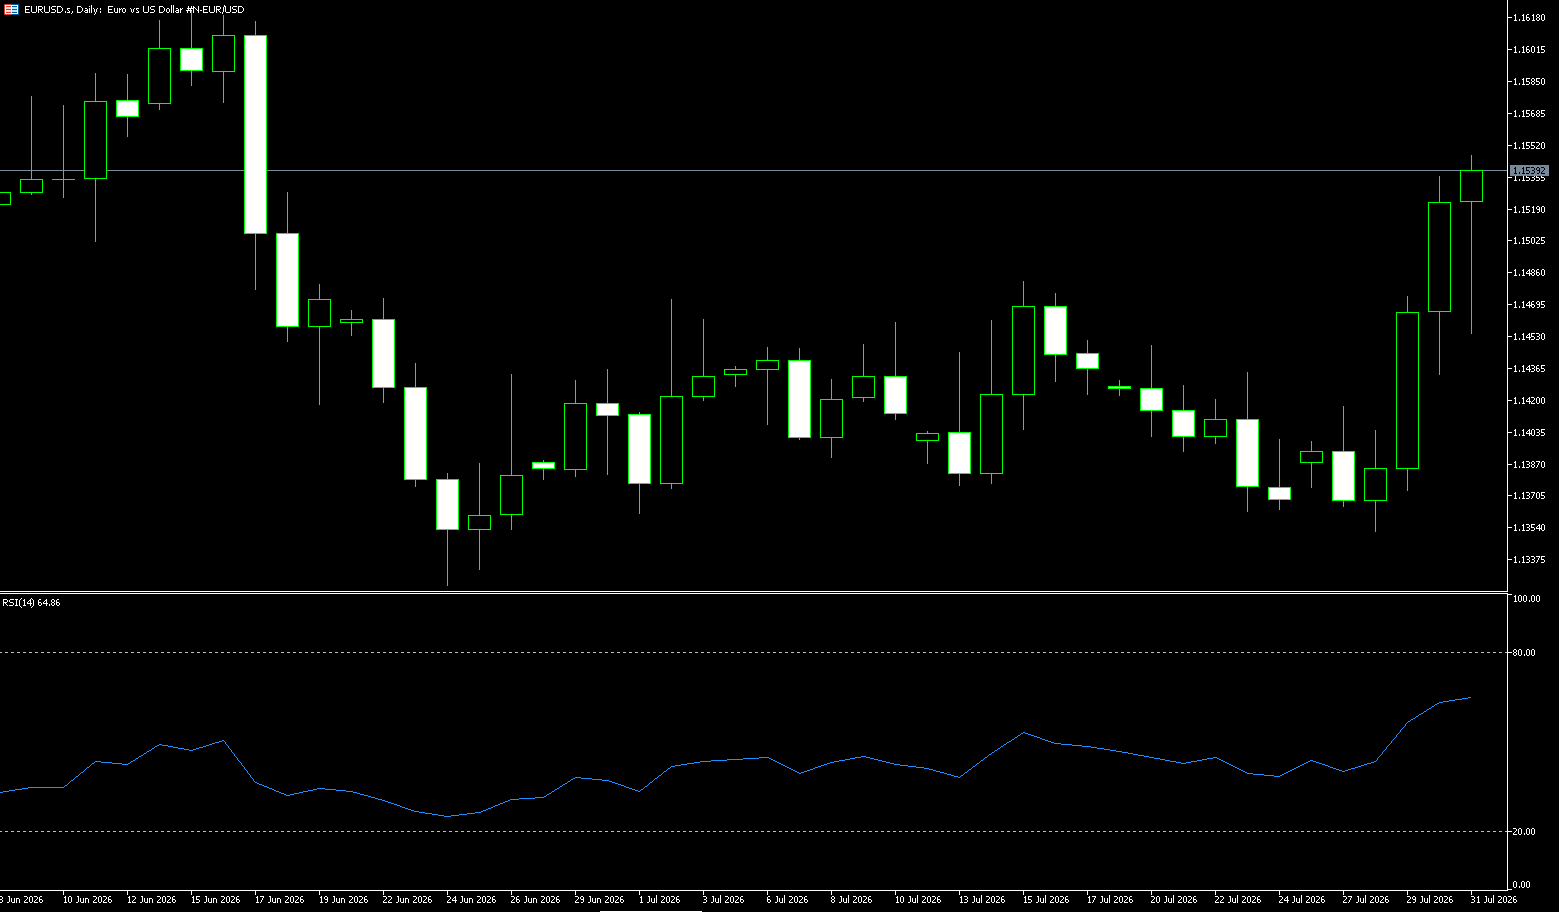
Last week, the euro/dollar pair hit a low of 1.1353; after the Fed's rate decision, dollar bulls took profits, and the euro rebounded, rising to a high of 1.1537 during the week, closing with a medium-sized bullish candlestick indicating a bottoming out and recovery. The exchange rate rebounded strongly from the 1.1353 support zone, stabilizing above the 20-day moving average at 1.1424. The RSI has risen from a low to around 60, nearing overbought territory. The MACD histogram is contracting and about to form a golden cross, indicating a short-term recovery in bullish momentum. On the daily chart, EUR/USD remains under pressure in the short term as the spot price remains below the 100-day simple moving average (1.1568), suggesting that upward attempts are encountering selling pressure. This will be the next major resistance level that bulls need to reclaim to alleviate broader bearish pressure.
The expected scenario for this currency pair next week (baseline scenario, higher probability): EUR/USD will consolidate within a range; the exchange rate will fluctuate repeatedly between 1.1424 (20-day simple moving average) and 1.1600 (psychological level). Meanwhile, after a rapid short-term rebound, bullish momentum has been exhausted, and resistance is forming at 1.1537. The market is awaiting next week's US non-farm payrolls and Eurozone economic data for a new direction, making a direct unilateral breakout unlikely. A decisive break above 1.1537 (last week's high) would open up upward potential, targeting 1.1585 to 1.1630. Conversely, a break below 1.1464 (the 45-day simple moving average) and continued trading below it would signal the end of the rebound phase, with a pullback to test 1.1424 (the 20-day simple moving average) and the key support zone around the psychological level of 1.1400.
Today, consider going long on the Euro at 1.1512, with a stop-loss at 1.1500 and targets at 1.1560 and 1.1575.
Stock Analysis:
Australian ASX 200 Stock Index
Basic Market Overview:
The Australian Securities Exchange (ASX) 200 index fell 71 points, or 0.8%, to close at 8,968 on Thursday, ending a three-day rally and retreating to a near five-month high. Investors took profits, following Wednesday's plunge on Wall Street, as traders weighed the impact of the Federal Reserve's decision to keep interest rates unchanged and three officials' support for a 25-basis-point rate hike. Geopolitical tensions increased pressure following Iran's raid on a US base in Jordan. Domestically, Reserve Bank of Australia Assistant Governor Sarah Hunt noted that overall inflation was slowing, although housing and service costs remained stubborn. Losses were widespread, with technology, logistics, retail, and non-energy mining sectors leading the decline.
Weaker iron ore and copper prices dragged down BHP Billiton (-1.4%) and Fortescue Metals (-0.9%). Gold mining companies saw sharp declines, with Northern Star Resources (-3.5%) and Evolution Mining (-2.8%) suffering heavy losses. Two of the Big Four banks saw declines between 0.5% and 0.8%. Conversely, Domino's Pizza shares surged 8.6% after confirming its annual profit outlook, despite a write-down.
Sector Performance:
Leading Sectors (Defying the Trend)
1. Energy
Driven by: Middle East geopolitical conflicts pushing up oil premiums; Ampol raising earnings expectations
Core Stocks: Ampol (+1.7%), Woodside Energy, Santos slightly up
2. Financials
The four major banks diverged, Westpac and National Australia Bank closed higher, while hedging insurance and investment banking sectors declined; the interest rate environment supported bank net interest margin expectations
3. Some Consumer Discretionary Sectors (Stock-Driven)
Domino’s Pizza (DMP) +9.08%, better-than-expected earnings guidance boosted consumer discretionary stocks in some areas
Leading Sectors (Mainly Dragging Down the Index)
1. Information Technology (Weakest Sector of the Day)
The sharp decline in US tech stocks spread, with most cloud and data center stocks weakening
Weak Stocks: Nextdc (-3.0%), Zip sharply down
Divergence: WiseTech Global bucked the trend, rising 6.67%
2. Basic Materials (Mining/ Materials (Gold)
Iron ore and copper prices weakened; the gold sector saw a significant pullback.
Weak stocks: BHP (-1.4%), Fortescue Metals, Northern Star Resources (-3.5%), Evolution Mining (-2.8%)
Divergence: Mineral Resources and PLS lithium mines bucked the trend and closed higher.
3. Utilities and REITs: Interest rate sensitive sectors, with profit-taking after continuous gains.
4. Consumer Staples and Logistics: Sectors that had seen significant gains previously saw profit-taking.
Technical Analysis:
The Australian Securities Exchange 200 index closed at 8968 points on Thursday, down 0.8% on the day, ending a three-day winning streak and retreating from the recent high of 9086. Medium-term trend: Slightly bullish with fluctuations; the index continued its upward trend in July, but encountered resistance after reaching 9086 on Thursday, forming a false breakout, indicating a significant weakening of short-term bullish momentum. Short-term structure: After three consecutive days of gains, profit-taking, coupled with overnight adjustments in US stocks and a hawkish signal from the Federal Reserve triggering a decline in risk appetite, has led the index into a short-term correction phase. Key technical indicators: RSI: Falling from overbought territory but not yet oversold, further downside potential remains; MACD: The bullish histogram is contracting, showing signs of turning downwards; The index has broken below the short-term 5-day moving average, shifting from a strong upward trend to a consolidation phase. Short-term neutral to bearish consolidation. Holding above 8900 will maintain the high-level consolidation pattern; a decisive break below 8900 would open the door to further correction towards the 8840-8700 range. Only a retest of 9086 can restart the bullish trend.
Trading Strategies:
The following are technical trading ideas only and do not constitute investment advice. Leveraged trading may result in losses exceeding the principal.
Bull Strategy (Buy on Dips, Be Cautious of Chasing Highs)
1. Ideal Buy Range: A small long position can be initiated around 8900 if the price stabilizes and closes positive.
Target: 9030 → 9086; Stop Loss: Below 8870
2. Aggressive Long Strategy: Chasing the price directly above 8960 is not recommended, as a false breakout carries significant risk.
3. Bullish Failure Condition: A daily closing price below 8900; abandon the long position strategy.
Bear Strategy (Sell on Resistance, Speculate on Dips)
1. Shorting Range: A rebound to 9020-9030 followed by resistance and stalling.
First Target: 8900; Second Target: 8840; Stop Loss: Above 9090
2. If the price breaks below 8900 decisively, add to the position targeting 8840.
Key Risk Warning External Risks:
The Fed's hawkish expectations continue to push up US Treasury yields, suppressing global risk assets; Middle East geopolitical conflicts could disrupt risk appetite at any time; fluctuations in iron ore, copper, and gold prices directly impact the heavyweight mining sector; Australian dollar exchange rate fluctuations interfere with listed companies' earnings expectations.
Domestic Macroeconomic Risks:
Australian inflation data remains resilient, and the market continues to price in the possibility of an RBA rate hike; the upcoming Australian earnings season presents uncertainty for resource and banking stock performance guidance.
Technical Risks:
If the 8900 support level is effectively broken, further downside potential will open up; conversely, if the 9085 high is quickly recovered, the challenge for the year's high of 9202 will resume.
Dow Jones Industrial Average:
Basic Market Conditions:
On the last trading day of July, the three major US stock indices all closed higher. Although US Treasury yields continued to climb, and the Middle East situation and inflation risks kept the market vigilant, Amazon's strong earnings report eased investors' concerns about the return on investment in artificial intelligence, driving up large-cap tech stocks and major indices. At the close of trading, the Dow Jones Industrial Average rose 276.97 points, or 0.53%, to 52,485.03; the S&P 500 rose 0.70% to 7,489.72; and the Nasdaq Composite rose 1.00% to 25,373.85.
Last week, the S&P 500 rose 1.05%, the Nasdaq rose 1.59%, and the Dow rose about 1%. For the whole of July, the S&P 500 was essentially flat, the Nasdaq fell 3.2%, and the Dow rose 0.3%, marking its fourth consecutive month of gains. Both the S&P 500 and Nasdaq have risen about 9% year-to-date. Amazon's stock surged more than 15%, becoming a major driver of the market rally. The company's second-quarter revenue recorded its fastest growth in more than four years, with strong performance from its AWS cloud computing business boosting investor confidence that AI-related capital expenditures will eventually translate into revenue and profits.
Sector Performance:
Potential Leading Sectors & Key Component Stocks This Week (Dow Jones 30 Components)
1. Healthcare (Defensive Choice)
Logic: High dividends, stable cash flow; funds prefer defensive assets in a high-interest-rate environment; rotation of safe-haven funds.
Key Stocks:
Johnson & Johnson (JNJ), UnitedHealth Group (UNH)
Catalysts: Resilient consumer healthcare demand; relatively low valuations; hedging against macroeconomic uncertainties.
2. Industrial Aviation & High-End Manufacturing
Logic: Expected recovery in manufacturing PMI; continued strong demand for air travel; stable infrastructure orders.
Key Stocks:
Boeing (BA), Caterpillar (CAT)
Catalysts: Delivery data; expected overseas orders for construction machinery; core industrial stocks weighted in the Dow Jones Industrial Average.
3. Payment & Financial Leaders (Large Consumer Finance Companies)
Logic: Resilient consumption supports payment transaction volume; valuations have undergone a correction; marginal improvement in interest rate cut expectations benefits the financial sector.
Key Stocks:
Visa V, American Express AXP
Potential Declining Sectors & Key Component Stocks This Week (Dow Jones 30 Components)
1. Consumer Electronics Hardware (Technology Hardware)
Logic: Weaker-than-expected consumer recovery, slower growth in hardware capital expenditure; continued negative sentiment surrounding Apple's earnings.
Key Stock: Apple AAPL
Risks: Weak hardware sales expectations, sluggish service business growth, high US Treasury yields suppressing high-valuation technology stocks.
2. Traditional Energy (Dow Jones Energy Components)
Logic: Increased oil price volatility; a correction in crude oil prices would drag down the energy sector; fading geopolitical premiums would also put pressure on the sector.
Key Stock: Chevron CVX
3. Retail Discretionary Consumption
Logic: Continued depletion of US household savings, marginal weakening of consumption expectations.
Key Stocks: Disney (DIS), McDonald's (MCD)
Technical Analysis:
The Dow Jones Industrial Average (DJIA) closed last week at 52485.03; a weekly gain of +1.04%. The weekly trading range was 51551 ~ 52901 points, a wide range of fluctuations. Mid-week, the Federal Reserve kept interest rates unchanged, but three members advocated for a rate hike, and the Chairman released hawkish signals, dispelling market expectations for short-term rate cuts; US Treasury yields surged, triggering a panic sell-off. Subsequently, the market rebounded from its lows, holding the key low of 51600; the index is trading below the 20-day moving average, indicating a weakening of the medium-term upward trend; the weekly RSI has fallen back to the neutral range, not entering oversold territory, and the rebound lacks clear bullish momentum; the MACD histogram continues to narrow, indicating weakening bullish momentum. Next week's key event: US July non-farm payroll data (Friday evening). The employment data will directly affect expectations for Federal Reserve policy and is highly likely to trigger significant volatility. Technical Characteristics: Short-term: Consolidation and bottoming pattern; the recovery after Wednesday's sharp drop is an oversold rebound and has not yet reversed the downward pressure. Medium-term: The upward channel is entering a testing phase; 51550 is the lifeline for this round of bulls. Volatility forecast: Volatility will increase significantly next week, and a long shadow and sharp fluctuations are very likely on the day of the non-farm payrolls report.
Trading Strategy:
This Week's Trading Strategy (Short-term 3-5 day cycle)
1. Bullish Strategy: If the index stabilizes above 52950, take a small long position, with a target of 53250-53300; stop loss at 52600.
Priority allocation: Healthcare and industrial blue chips (UNH, BA, CAT).
2. Bearish Strategy: If the index breaks below 51900, look for a pullback, with a target of 51450; stop loss at 52250.
Focus on shorting: AAPL; if the overall market weakens, the decline could be amplified.
3. Neutral Strategy (High Probability): Buy low and sell high within the range; reduce long positions near 53200, and buy low near 51500.
Reduce positions before the non-farm payroll data release to avoid the risk of a gap caused by the data.
Key Risk Warnings:
1. Non-farm payroll data deviates significantly from expectations, directly changing expectations of the Fed's interest rate cut path and triggering sharp fluctuations in US Treasury yields;
2. Repeated geopolitical conflicts in the Middle East disrupt oil prices and risk appetite;
3. Several leading US stock companies lowered their guidance at the end of their earnings reports, triggering a revaluation of blue-chip stocks;
4. Dow Jones price-weighted characteristics: A few high-priced stocks (UNH, BA, AAPL) can significantly distort the index trend; do not rely solely on the index to judge individual stocks.
Disclaimer: The information contained herein (1) is proprietary to BCR and/or its content providers; (2) may not be copied or distributed; (3) is not warranted to be accurate, complete or timely; and, (4) does not constitute advice or a recommendation by BCR or its content providers in respect of the investment in financial instruments. Neither BCR or its content providers are responsible for any damages or losses arising from any use of this information. Past performance is no guarantee of future results.
Lebih Liputan






Pendedahan Risiko:Instrumen derivatif diniagakan di luar bursa dengan margin, yang bermakna ia membawa tahap risiko yang tinggi dan terdapat kemungkinan anda boleh kehilangan seluruh pelaburan anda. Produk-produk ini tidak sesuai untuk semua pelabur. Pastikan anda memahami sepenuhnya risiko dan pertimbangkan dengan teliti keadaan kewangan dan pengalaman dagangan anda sebelum berdagang. Cari nasihat kewangan bebas jika perlu sebelum membuka akaun dengan BCR.
BCR Co Pty Ltd (No. Syarikat 1975046) ialah syarikat yang diperbadankan di bawah undang-undang British Virgin Islands, dengan pejabat berdaftar di Trident Chambers, Wickham’s Cay 1, Road Town, Tortola, British Virgin Islands, dan dilesenkan serta dikawal selia oleh Suruhanjaya Perkhidmatan Kewangan British Virgin Islands di bawah Lesen No. SIBA/L/19/1122.
Open Bridge Limited (No. Syarikat 16701394) ialah syarikat yang diperbadankan di bawah Akta Syarikat 2006 dan berdaftar di England dan Wales, dengan alamat berdaftar di Kemp House, 160 City Road, London, England, EC1V 2NX. Open Bridge Limited bertindak semata-mata sebagai pemproses pembayaran untuk BCR Co Pty Ltd dan tidak menyediakan sebarang perkhidmatan kewangan, perdagangan atau pelaburan bagi pihaknya. Peranan Open Bridge Limited adalah terhad kepada pemprosesan pembayaran.


 English
 简体中文
简体中文
 繁體中文
繁體中文
 Bahasa
Melayu
Bahasa
Melayu
 Tiếng
Việt
Tiếng
Việt
 ไทย
ไทย
 日本語
日本語
 한국어
한국어
 ភាសាខ្មែរ
 español