


0
US Dollar Index
The US Dollar Index, which tracks the performance of the U.S. dollar against a basket of currencies, entered a bullish consolidation phase after hitting a near one-month high of around 100.86 during Asian trading late last week. Still, the index is on track for its third straight weekly gain and appears poised to build on its multi-year lows hit in April. The dollar posted its third straight weekly gain, supported by improving global trade sentiment and fading expectations of an upcoming rate cut. The rally was driven in part by President Trump’s announcement of a preliminary trade deal with the United Kingdom, the first since the U.S. imposed massive tariffs last month. Trump also hinted at the possibility of additional deals and suggested tariffs on China could be eased depending on the outcome of upcoming trade talks in Switzerland. On the monetary policy front, Federal Reserve Chairman Jerome Powell dismissed the idea of a preemptive rate cut to counter the possible economic impact of tariffs. Powell also warned of elevated inflation and unemployment risks, suggesting caution before further policy adjustments. Last week, the dollar posted its strongest gains against the euro, New Zealand dollar and Australian dollar.
The US dollar index closed higher for the third week last week and entered a bullish consolidation phase after hitting a near one-month high of about 100.86 in the Asian session last weekend. The index is currently trading around 100.50, and the price trend is still limited to the range of 99.45 {lower track of the daily horizontal channel}–101.06 {34-day simple moving average}. The 14-day relative strength index (RSI) of the technical indicator of the daily chart is around 48.90. The moving average convergence/divergence (MACD) issued a buy signal, and the ultimate oscillator also remained neutral around 61.24. Mixed moving average signals highlight hesitation: the downside direction first looks at 100.00 {market psychological barrier}, followed by the 20-day simple moving average of 99.60, and 99.45 {daily horizontal channel lower track} to support buyers. In addition, last week's high of 100.86 is the first resistance level, and the next level will point to 101.06 {34-day simple moving average}, and continue to test the 101.40 {daily horizontal channel upper track} area level.
Today, consider shorting the US dollar index around 100.55, stop loss: 100.70, target: 100.10, 100.00

WTI spot crude oil
WTI crude oil rose again to around $60.70 per barrel before the weekend, marking a weekly increase of more than 4%. Optimism was boosted by news that U.S. Treasury Secretary Scott Bessant will meet Chinese Vice Premier He Lifeng in Switzerland on May 10, suggesting possible progress in resolving trade disputes. These disputes have suppressed global crude oil demand. Second, it was boosted by easing trade tensions between major oil consumers, the United States and China, and the announcement of a "breakthrough" trade deal between the United States and the United Kingdom. On the other hand, despite the recent gains, oil prices still face significant resistance. OPEC and its allies (OPEC+) plan to increase oil production, which may put pressure on prices. In another development, U.S. President Trump and British Prime Minister Keir Starmer said that the United Kingdom has agreed to reduce tariffs on U.S. imports from 5.1% to 1.8%. The United States cut tariffs on British cars while maintaining 10% tariffs on most other goods. Supported by optimism about U.S.-China trade negotiations. Officials from the two countries plan to meet this weekend, raising hopes of resolving trade tensions between the world's two largest oil consumers and easing concerns about global crude oil demand.
Technically, the daily chart of U.S. crude oil shows a clear short-term uptrend. It has successfully broken through multiple short-term moving average pressures, and the 5-day, 10-day, and 20-day simple moving averages have formed a long arrangement. The current oil price has risen to around $60.00 {market psychological barrier}, indicating that the market sentiment is strong in the short term. In terms of technical indicators of the daily chart, the MACD double lines have just formed a golden cross, and the momentum column has turned red, indicating that there is still upward momentum in the short term; but the 14-day relative strength index (RSI) index is in the negative area near 47.30, and has not yet entered the oversold area, but is close to the warning range, suggesting that the upside may be limited. At this stage, WTI oil prices are approaching the key resistance levels of $61.35 {38.2% Fibonacci rebound level from 71.98 to 54.78} and $61.55 {28-day simple moving average}. If the volume breaks through, it may test the $63.38 {50.0% Fibonacci rebound level} level in the future. However, if the rise is blocked, the market may experience a correction, with the short-term important support level near $58.83 {23.6% Fibonacci rebound level from $71.98 to $54.78}, the next level is $57.47 {last Thursday's low}, and the stronger support is near the $55.14 {May 6 low} level.
Today, you can consider going long on crude oil near 60.50, stop loss: 60.30; target: 61.80; 62.20

Spot gold
The price of gold showed a trend pattern of rising first and then falling last week, falling to $3,275 before the weekend. Optimism about the US-China trade negotiations has weakened the appeal of safe-haven assets. Officials from the two countries plan to meet over the weekend, raising hopes of progress in resolving trade disputes. The announcement of the US-UK trade agreement further eased concerns about global trade tensions. Additionally, the Federal Reserve kept its key interest rate unchanged, in line with expectations, while warning of rising inflation and unemployment risks, reinforcing its cautious stance on future policy moves. Fed Chairman Powell also stressed that the Fed is not considering a pre-emptive rate cut to counter the possible economic consequences of tariffs. Gold prices are still on track for weekly gains despite the recent decline. Secondly, gold prices turned positive after sliding to the $3,275-3,274 area as geopolitical risks arising from the Russia-Ukraine war, escalating tensions in the Middle East, and the situation on the India-Pakistan border restored safe-haven demand. Apart from this, the dollar's slight pullback after hitting a near one-month high earlier before the weekend became another supportive factor for the commodity. Moreover, the Trump administration is reportedly considering reducing tariffs on China from 145% to 50%, which may be implemented next week, which further boosted market optimism and may limit gold's gains.
From the daily chart, gold prices rose to a weekly high of $3,440 last Wednesday, and the rise paused after forming a "small double top" pattern with Tuesday's high of $3,438. Gold fell below $3,400, opening a continuous decline of more than 4.5% or $165. After a sharp drop to a low of $3,275, gold prices are currently recovering above $3,300. Although the oscillator on the daily chart has lost momentum, it has not yet confirmed a negative bias. Therefore, caution is needed before laying out a deeper decline, and gold prices may find some support around the level of $3,275 {last week's low}. However, subsequent selling should pave the way for a fall to last week's low support of $3,237.80, while the next level target is 3,202 {May 1 low}, and around the $3,200 {market psychological barrier} area. On the other hand, the 5-day simple moving average is around the $3,352 area, which now seems to be an immediate obstacle. Any further gains may attract some sellers and limit the gold price to resistance around $3,371.80 {23.6% Fibonacci retracement of 2956.80 to 3,500.10}. A sustained strong breakout should allow the gold/dollar pair to recapture the $3,400 round-figure mark and climb further to the next relevant barrier of $3,440 area, or weekly high level.
Consider going long gold before 3,320 today, stop loss: 3,315; target: 3,350; 3,360

AUD/USD
AUD/USD fell below $0.6400 to $0.6370 before the end of last week, hitting a one-week low, as the US dollar strengthened on the backdrop of improved global trade sentiment and reduced expectations of a recent US rate cut. The dollar's gains came after President Trump unveiled a preliminary trade deal with the UK, the first agreement since the massive US tariffs were imposed last month. Trump also hinted that more deals could be on the way and hinted that tariffs on China could be eased based on high-level trade talks to be held in Switzerland this weekend. The Australian dollar also faced resistance after Fed Chairman Powell opposed the idea of an insurgent rate cut, citing persistent inflation and employment risks. Domestically, the Australian dollar remains under pressure as the market increasingly prices in a 25 basis point rate cut by the Reserve Bank of Australia at its May meeting amid rising external uncertainties amid clear signs of an economic slowdown. On the other hand, citing sources from the Chinese Embassy in the United States, Beijing is unlikely to reduce tariffs before the upcoming Swiss talks. This adds to market uncertainty and dampens risk sentiment. Given the close economic ties between Australia and China, any pressure on the Chinese economy tends to be negative for the Australian dollar.
From the daily chart, AUD/USD remains range-bound with traders eyeing upcoming economic data for direction. The outlook for AUD/USD appears mixed. Currently, AUD/USD is trading around 0.6400, showing some bearish signals. The 14-day relative strength index (RSI) of the technical indicator remains neutral with a reading of around 54.17, while the moving average convergence divergence (MACD) continues to send buy signals, suggesting the potential for an upward move. A successful break above the 200-day simple moving average of 0.6456 will turn the outlook for AUD/USD to a more constructive one. Additional gains are expected to face initial resistance at 0.6500 {market psychological barrier}, and the 2025 high of 0.6514 (May 7), followed by the 2024 high of 0.6562 on November 11. Interim support levels are located at the 25-day simple moving average of 0.6344, and a break below the above levels may bring 0.6300 {market psychological barrier} into view.
Today, we recommend going long on AUD before 0.6400, stop loss: 0.6385, target: 0.6450, 0.6460

GBP/USD
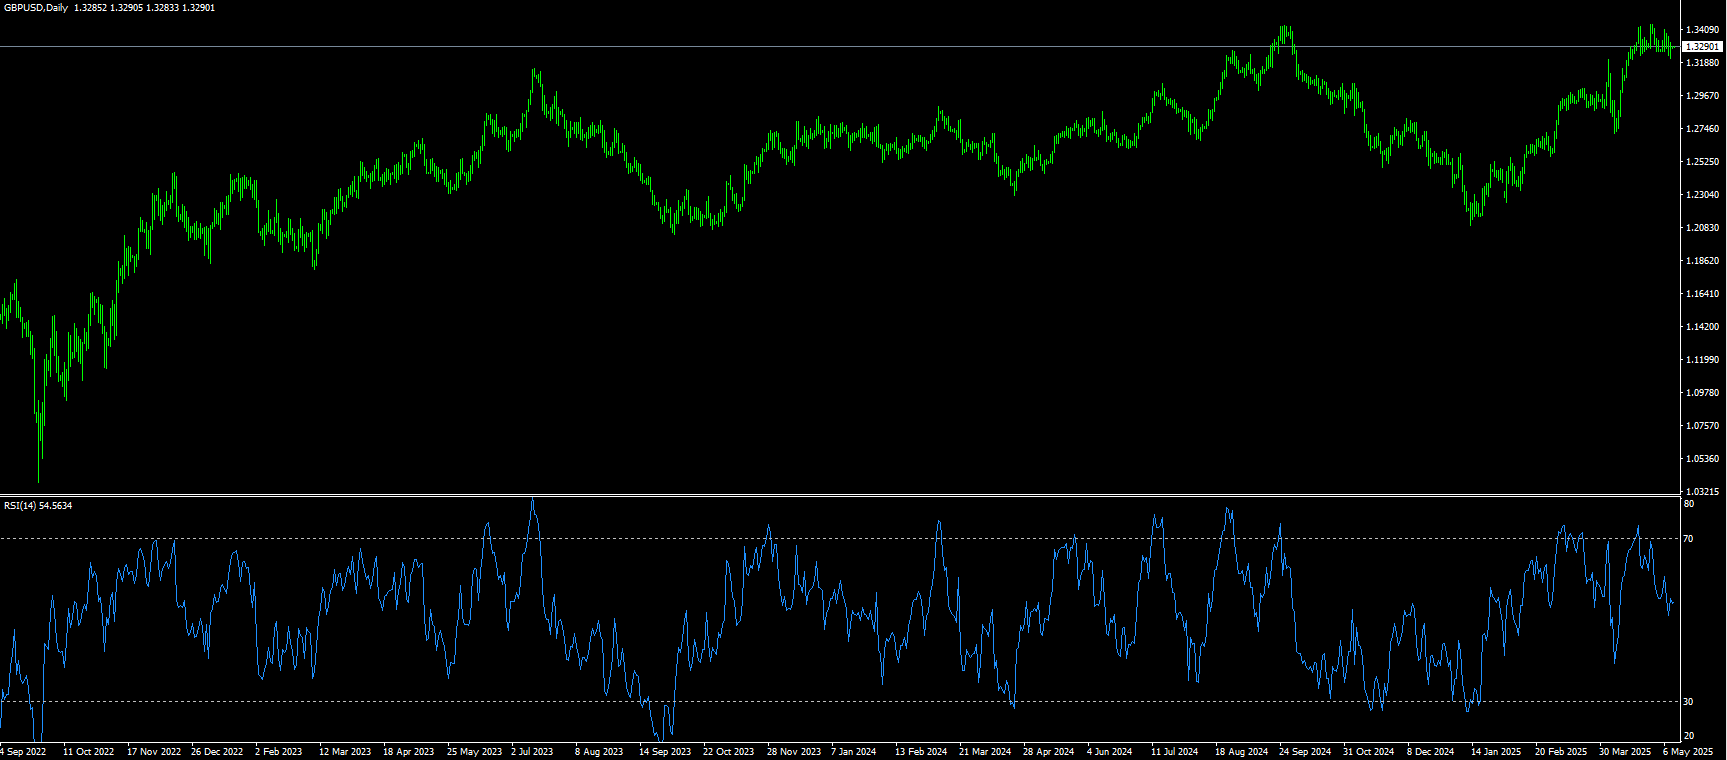
The British pound recorded solid gains before the end of last week, as the British pound rose on the announcement of a trade deal between the United States and the United Kingdom. However, the BoE's rate cut limited its gains, but the pair still traded around 1.33 after rebounding from a daily low of 1.3212. US President Trump and British Prime Minister Keir Starmer announced a bilateral trade deal that maintains Trump's 10% tariff on British exports but opens up markets for both countries. The news limited the decline of GBP/USD after the BoE's decision to cut interest rates by 25 basis points. At the same time, market expectations for the BoE's interest rate show that traders are reducing the probability of a rate cut in June, but expect a 50% probability of a rate cut in July. The British pound maintained its gains, supported by a weaker dollar. On the data front, the US economic calendar features speeches by several Fed officials. Fed official Adrienne Kugler said the labor market is close to full employment and pointed out that current monetary policy is moderately restrictive. Meanwhile, market expectations for the Bank of England's interest rate suggest that traders are reducing the probability of a rate cut in June, but expect a 50% chance of a rate cut in July.
The pound attracted bids near the three-week low of 1.3212 at the end of last week, after which the pair rebounded and fluctuated above 1.3300. The 14-day relative strength index (RSI) of the daily chart technical indicator appears stable around 56.35. If the RSI falls below the 50.00 level, it will trigger bearish momentum. For now, GBP/USD maintains an upside bias and buyers need to recapture 1.3324 {10-day simple moving average}, while the chain resistance is at the round number mark of 1.3400 in order to form a higher high and have a chance to test the yearly high of 1.3445. In the case of further strength, the next resistance level is 1.3500 {market psychological mark}. On the other hand, the upward trend of GBP/USD is questioned as the exchange rate shows three consecutive days of lower highs and lower lows, indicating that buyers are losing momentum. Momentum-based indicators such as the relative strength index (RSI) have reached their lowest level since mid-April, indicating that sellers are stepping in. Therefore, if the currency pair falls below the 1.3300 mark, it may clear the path to test 1.3250, followed by the three-week low of 1.3212, and the 1.3200 mark area.
Today, it is recommended to go long on GBP before 1.3295, stop loss: 1.3280, target: 1.3350, 1.3360
USD/JPY
The USD/JPY pair rebounded to a near one-month high of 146.20 after the Federal Reserve kept interest rates unchanged last week and released hawkish signals, but failed to sustain a break above the key 50-day moving average of 146.33. Fed Chairman Powell said after last week's interest rate meeting that current policy should "wait for more data" and expressed concerns about trade uncertainty. Fed Chairman Powell's remarks further pressured the yen, and he rejected the idea of a precautionary rate cut, pointing to persistent inflation risks and concerns about the labor market. On the domestic front, data showed that Japan's personal spending grew more than expected in March, providing a positive signal for consumption. However, real wages fell for the third consecutive month, casting a shadow on the overall economic outlook. Meanwhile, the first deal with the UK since the US tariffs was reached, Trump also hinted at more trade deals and said that tariffs on China may be eased depending on the results of high-level trade talks held in Switzerland over the weekend. And eased concerns about a US recession, which in turn could pose a headwind for the yen. In addition, the Fed's hawkish pause on Wednesday should limit any significant correction in the dollar from its near one-month high and limit the downside of USD/JPY. Traders are now looking forward to speeches from Fed officials for fresh impetus.
From a technical perspective, USD/JPY’s breakout above the 200-hour SMA on the 4-hour chart can be seen as a key trigger for bullish traders {the first time it touched the 200-hour SMA at the beginning of this month: it was at 145.81 before immediately retracing to 142, and this time it broke through the 200-hour SMA again on Thursday at 145.05}. Moreover, the oscillators on the daily chart have started to gain positive momentum and remain in the bullish zone on the hourly chart. This supports the prospect of some bargain hunting buyers in the spot price around the 145.00 psychological mark (200-hour SMA on the 4-hour chart). That said, if the above resistance-turned-support holds, the bulls may re-challenge the 146.15-146.20 area, which was the peak during the Asian trading session last Friday, and pave the way for further appreciation of USD/JPY. The subsequent rise may lift the spot price to the intermediate resistance in the 146.75-146.80 area, which in turn points to the 147.00 round mark. The momentum could extend further to the supply zone of the 148.00 round number. On the downside, the 144.53{30-day moving average} and 142.35{last week's low} areas can be watched.
Today, it is recommended to short the US dollar before 145.60, stop loss: 145.85; target: 144.20, 144.00

EUR/USD
The EUR/USD trend fell repeatedly last week, once hitting a one-month low of 1.1190, and is currently trading around 1.1250 during the weekend. The currency pair depreciated as the dollar was supported by optimistic US economic data and signs of easing trade tensions. US President Trump announced a "significant" trade deal with the UK, although key tariffs remained at 10%, which curbed market optimism. Attention now turns to the initial US-China trade talks in Switzerland this weekend, but both sides are cautious about expectations of a breakthrough. Trump continues to take a tough stance on China, especially after appointing a new envoy to Beijing. Despite the ongoing discussions on potential tariff exemptions, the US administration remains cautious, with Trump saying they are "not looking for that many exemptions". On the data front, US initial jobless claims fell to 228,000 in the week ended May 3, slightly below expectations and down from an unrevised 241,000 in the previous week. Meanwhile, the euro remains under pressure as expectations grow that the ECB will cut interest rates further, perhaps as early as the June meeting.
EUR/USD buyers have been very aggressive in the 1.1250-1.1300 area for most of the past few weeks. The breakout late last week is meaningful. Optimism about the dollar has slightly recovered as Trump's hopes for an imminent trade deal grow and market signs seem to be paying more attention, EUR/USD continues to find buying support around the 5-day simple moving average near 1.1255. While the 14-day relative strength index (RSI) remains slightly above 51.88, the short-term upside potential is still insufficient, suggesting that the current bullish momentum may have ended. The MACD moving average convergence/divergence indicator has turned negative, suggesting that the intraday strength has weakened. However, the upward bias remains. Looking up, the psychological level of 1.1300 will be the main resistance level for the currency pair. If buyers maintain control in the broader trend this time, there is a chance to reverse and rise to 1.1330{21-day simple moving average}, and 1.1381{last week's high}. A break will further point to 1.1400{round mark}, and 1.1473{April 11 high} area to open the door. On the contrary, 1.1200{round mark}, and 1.1190{last week's low} will be the key support levels for euro bulls. A break will test the 1.1117{40-day simple moving average} level.
Today, it is recommended to go long on the euro before 1.1235, stop loss: 1.1220, target: 1.1288, 1.1300.

Disclaimer: The information contained herein (1) is proprietary to BCR and/or its content providers; (2) may not be copied or distributed; (3) is not warranted to be accurate, complete or timely; and, (4) does not constitute advice or a recommendation by BCR or its content providers in respect of the investment in financial instruments. Neither BCR or its content providers are responsible for any damages or losses arising from any use of this information. Past performance is no guarantee of future results.
More Coverage


Risk Disclosure:Derivatives are traded over-the-counter on margin, which means they carry a high level of risk and there is a possibility you could lose all of your investment. These products are not suitable for all investors. Please ensure you fully understand the risks and carefully consider your financial situation and trading experience before trading. Seek independent financial advice if necessary before opening an account with BCR.

 English
 简体中文
简体中文
 繁體中文
繁體中文
 Bahasa
Melayu
Bahasa
Melayu
 Tiếng
Việt
Tiếng
Việt
 ไทย
ไทย
 日本語
日本語
 한국어
한국어
 ភាសាខ្មែរ
 español